Home / Insights / Shopify conversion rate optimization: what to fix first
Sales · 20 min read
Shopify conversion rate optimization: what to fix first
Your store gets decent traffic, too few visitors buy, and every tweak leaves the number where it was. Here is how to find the step where they stop, fix it in the right order, and tell whether the fix really worked.
The short answer
Shopify conversion rate optimization starts with the step where most visitors drop out, which the Conversion rate breakdown report shows. Fix traffic quality and product pages before checkout tweaks, and judge every change by sales per visit. On one store, Shopify's own reports showed the conversion rate barely moved (0.9% to 0.9%) while sales per visit rose 39%, from $2.13 to $2.95.
Shopify conversion rate optimization is the work of turning more of the visits you already get into orders. Shopify defines conversion rate in one line: “The percentage of sessions that resulted in a purchase.” Its behavior reports reveal the step where those sessions stop.
The goal is not a prettier percentage. It is more sales from the same traffic, so growth does not depend on a bigger ad bill every month. Four terms come up in every conversation about it:
Term
Short name
What it means
Where to find it
Conversion rate optimization
CRO
Finding the step where visitors stop buying and removing the reason
The reports below, read together
Conversion rate
CR
Sessions that completed checkout divided by all sessions
Conversion rate over time
Average order value
AOV
Gross sales minus discounts, divided by orders
Average order value over time
Sales per visit
Revenue per session
Total sales divided by sessions for the same dates
Total sales over time and Sessions over time, divided by hand
The last row is the key number in this guide. It is the only one of the four that tells you whether the business earns more from each visitor.
What is a normal Shopify conversion rate?
One Shopify-only benchmark puts the average at 1.4 percent of sessions. Littledata, an analytics company, benchmarked 2,800 Shopify sites in 2023 and found 1.2 percent on mobile and 1.9 percent on desktop. Anything above 3.2 percent put a site in the top 20 percent of its benchmark, and above 4.7 percent in the top 10 percent.
What is the average ecommerce conversion rate?
Across all of ecommerce, published averages sit higher. Dynamic Yield’s benchmark page, checked in September 2026, put the global average at 2.72 percent. Dynamic Yield sells personalization software to enterprise businesses and aggregates the figure across its own customer base, so it describes big retailers more than a typical small online shop.
The same page shows how far conversion rates spread by industry: 5.39 percent for beauty and personal care against 0.72 percent for luxury and jewelry, over the past twelve months.
Benchmark
Figure
Publisher and date
Average site
1.4%
Littledata, 2,800 Shopify sites, 2023
Top 20% of sites
Above 3.2%
Littledata, 2023
Top 10% of sites
Above 4.7%
Littledata, 2023
Global ecommerce average
2.72%
Dynamic Yield, checked September 2026
Is a 1% conversion rate bad?
Not on its own. It sits below Littledata’s 1.4 percent average and a little under its 1.2 percent mobile figure, so there is room to improve.
But the store in the case study converted about 1 in 100 visits both before and after the work, by Shopify’s own reports, while its sales per visit rose 39% (dates and caveats in the next section). So check where the visits come from, and what each one earns, before you treat 1 percent as the problem.
Is a 2.5% conversion rate good?
For a Shopify site, yes. It is well above Littledata’s 1.4 percent average, short of its 3.2 percent top line, and close to Dynamic Yield’s all-ecommerce average. Whether it is good for you depends on your prices, your traffic and what each order is worth.
Is a 12% conversion rate on a website good?
For an online store, 12 percent is so far above these benchmarks that the first job is to check the measurement. Shopify’s analytics field reference says sessions are only counted when visitors consent to cookies through your cookie banner, so a banner most visitors ignore shrinks the bottom of the fraction. A shop that sells mostly to people who know it well will also post conversion rates that cold traffic would never match.
Treat every benchmark as somebody else’s business. It says nothing about your price point, your traffic mix or your margin, so use it as a sanity check and nothing more.
Can sales grow while conversion stays flat?
Yes, because conversion is a ratio, and a business can grow the top and the bottom of it at the same time. New visitors from new places can hold the share of buyers flat, or pull it down, while far more money comes in. If your conversion numbers look flat and your bank balance disagrees, you are not imagining it.
Here is one direct to consumer store on Shopify:
Measure
Before the work
About 90 days in
Visits (sessions)
4,276
7,970
Conversion rate
0.9%
0.9%
Orders
44
78
Total sales
$9,110
$23,532
Sales per visit
$2.13
$2.95
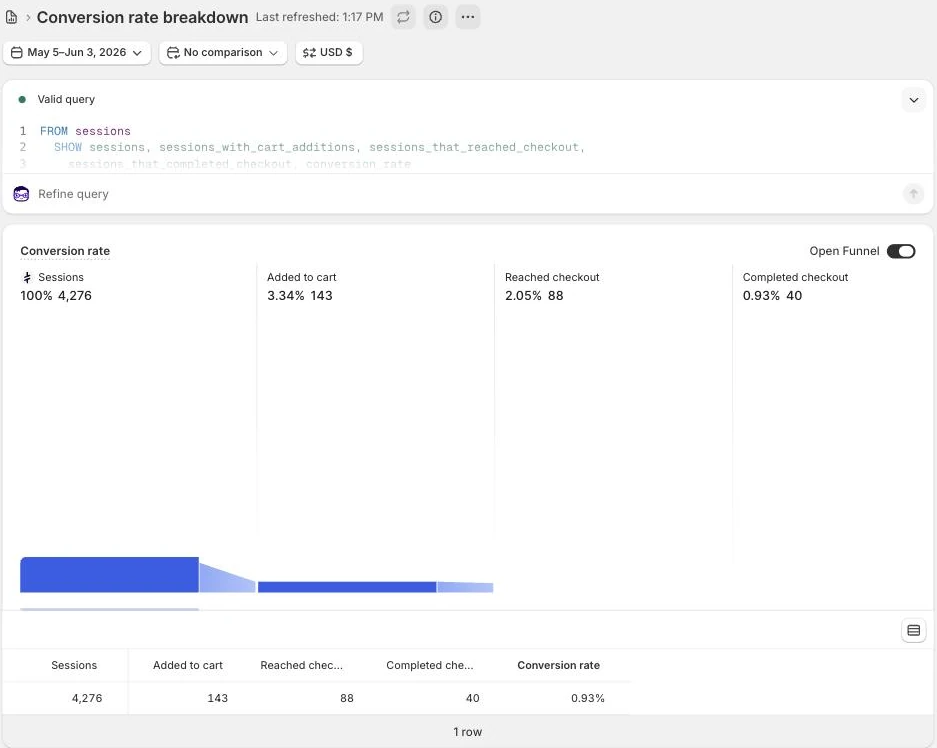
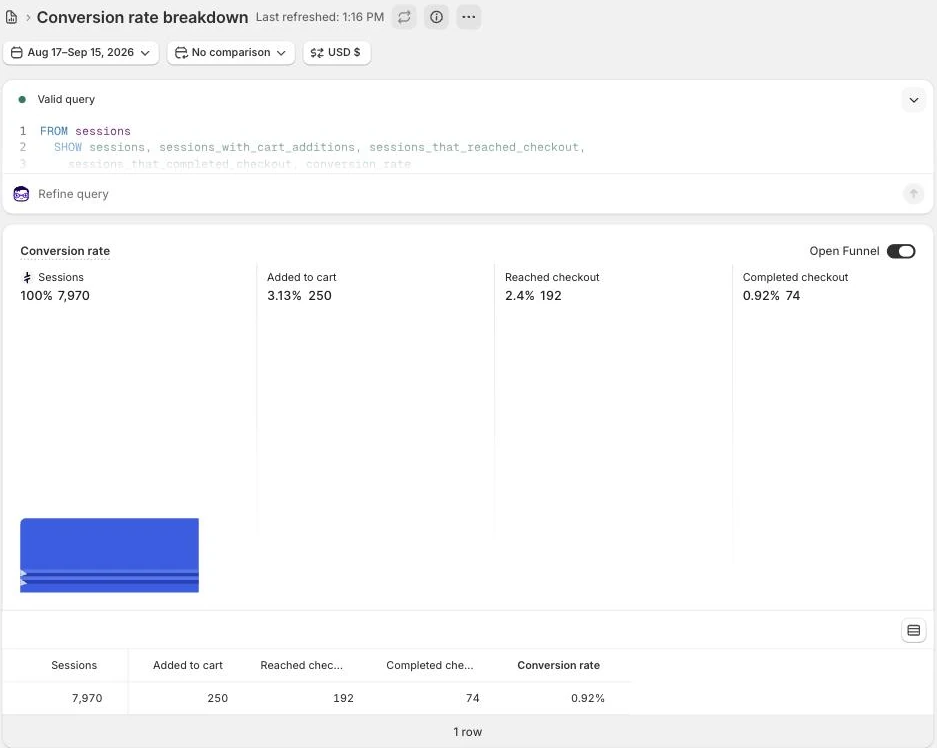
Source: Shopify’s own sales and sessions reports. Before is the 30 days before the work began (May 5 to June 3, 2026). After is the 30 days about three months in (August 17 to September 15, 2026).
Visits nearly doubled, from 4,276 to 7,970. About 1 in 100 visits bought in both windows, so the conversion rate barely moved. Sales per visit rose 39%, from $2.13 to $2.95, because better-matched buyers arrived and the orders got bigger, not because more of each hundred visitors checked out.
What it does not prove: this is one store, its Facebook ads ran in both periods, and one deposit order of $2,080 sits inside the after window. It does not prove conversion is irrelevant. It shows the conversion rate alone could not have told the owner the business was winning.
“there is no other single metric that is abused as much as conversion rate”
He wrote that in 2006, and the table above shows why it still holds: a CRO project graded on that one number would have been called a failure while sales grew 2.6 times.
What should you measure besides conversion?
Measure sales per visit: total sales divided by sessions for the same dates. It folds conversion and order size into one number, so a change cannot look like a win while you earn less.
A quick example shows the trap. A shop with 1,000 visits, 10 orders and a $100 AOV earns $1.00 per visit. Add a discount that lifts the conversion rate to 1.2 percent but drops the AOV to $75, and it earns $0.90 per visit.
The percentage went up. The shop got poorer.
Read three numbers together, all from Shopify’s own sales reports and behavior reports rather than an app’s dashboard:
Share of visits that buy, from Conversion rate over time.
AOV, from Average order value over time, which tracks how order size has changed.
Sales per visit, from Total sales over time divided by Sessions over time.
If conversion rises and sales per visit falls, the change cost money. If conversion falls and sales per visit rises, you are probably reaching new buyers who spend more. The guide to Shopify analytics covers which reports to trust when they disagree.
How do you calculate your Shopify conversion rate?
The admin calculates it for you, but know exactly what it divides. The formula in Shopify’s field reference is sessions that completed checkout divided by sessions. It is not orders divided by sessions, because one customer can buy twice in a single session.
Open the report. In Shopify, go to Analytics, then Reports, filter the list to Behavior, and open Conversion rate over time.
Pick fair dates. Choose at least a month and compare it with a stretch of the same length, ideally the same season a year earlier.
Read the funnel. Note sessions, sessions with cart additions, sessions that reached checkout and sessions that completed checkout.
Filter out bots. The field reference notes the figure can look lower than expected because of bot traffic and suggests filtering to human sessions.
Add the money. Open Total sales over time for the same dates and divide sales by sessions. That is your sales per visit.
Two cautions from Shopify’s help center. Sessions only count visitors who accept cookies, so a broken cookie banner distorts every ratio. And orders will not always match sessions that completed checkout, for the reason above.
Where do visitors drop out?
Shopify’s Conversion rate breakdown report lays it out as a funnel: all sessions, sessions with cart additions, sessions that reached checkout and sessions that completed checkout. Each step is divided by total sessions, so the biggest fall between two steps is the key place to look first.
Shopify's Conversion rate breakdown for one store in the 30 days before the work began (May 5 to June 3, 2026). Store name redacted.The same report for the 30 days about three months in (August 17 to September 15, 2026). About 1 in 100 visits completed checkout in both windows. Store name redacted.
What you see
What it usually means
Fix this first
Few sessions add anything to the cart
The wrong visitors, or a product page that leaves questions unanswered
Traffic sources, then the product page
Carts fill, few reach checkout
A surprise in the cart, usually shipping cost or delivery time
Put the full cost and a delivery date before the cart
Many reach checkout, few finish
Friction at checkout: forced accounts, missing payment methods, declined cards
Checkout settings and payment options
Most who reach checkout finish
Checkout is healthy
Leave it alone and work on traffic and the product page
On one store, 41 people started checkout during the 30 days to August 20, 2026, and 33 finished, on about 7,500 sessions a month (sources: Klaviyo and Shopify). Checkout was doing its job. The sales were being lost earlier, which is why its abandoned cart email had only eight people to reach.
Two more reports help here. Sessions by device splits visits by device type, and Shopify’s Sidekick assistant can report conversion by device if you ask it. Searches with no results lists what shoppers typed into your own search box and could not find.
What does a funnel look like when shipping is the surprise?
Like a staircase with one broken step. On one store, a high-ticket product sold on a deposit, GA4 recorded this funnel for the 60 days to September 18, 2026, after a cleaning rule had removed internal and data-center traffic:
Step
Count
Visits
307
Product views
154
Add to carts
15
Checkouts started
6
Past the shipping step
2
Purchases
2
Four of the six checkouts ended at the shipping step, the first place a buyer saw what shipping would cost. The two that got past it bought.
A read-only audit on September 19 found why. Shipping profiles set up at different times charged $35 flat on one profile, $38 on another, $12 on a third and $0 on the rest, so a starter product priced under $100 became $124 at checkout. Nothing on the product page, in the cart or in the FAQ said what shipping cost.
The page had other gaps. The main product’s Shopify price was the deposit, so Google’s listing and snippet showed the deposit as the price, with the full price, over $2,000, in paragraph four. There was no reviews app, no ratings, no review schema and 0 Google Business Profile reviews.
What it does not prove: 6 checkouts and 2 purchases are small numbers, GA4 only counts visitors whose browsers ran its tag, and it is one store over 60 days. What it shows is the order this guide argues for: the page and the cart had to say the full cost before any checkout tweak could matter.
Does traffic quality matter more than design?
Usually, yes. The same shop converts very differently depending on who arrives and why, and Shopify’s field reference suggests you compare conversion rates across traffic sources for exactly this reason. One store’s Shopify attribution report makes the point: same pages, same checkout, two kinds of traffic.
Google search, not paid24 ordersfrom 1,720 visits: 1.4 percent bought
Google search brought in more than 3.5 times the sales of the paid ads, from under a fifth of the traffic.
Source: Shopify’s sales attribution report for the 90 days before September 3, 2026. Google search brought $8,316 in sales and paid Facebook and Instagram $2,322, as charged. What it does not prove: the report credits each order to the visit it came from, so an ad that first introduced a buyer who later searched Google gets no credit.
The difference is intent. Someone who typed a search was already looking for the product. Someone scrolling a feed was not, and no button color changes that.
Audience matters inside one channel too. In the same case study, cold Facebook and Instagram audiences (August 3 to 25, 2026) produced 1 checkout for every 1,793 visits. Warm audiences of people who had visited or engaged before (August 26 to September 15, 2026) produced 1 in 179.
Both ran during the work, and its Facebook checkouts had ranged from 1 in 71 visits to 1 in 811 in earlier months, so read the gap as direction, not a constant. The math is in whether Facebook ads are worth it.
The cheapest way to increase conversions is often better traffic. For many stores that starts with Google free listings, where the people clicking are in the middle of shopping.
What should you fix first on a Shopify store?
Fix the earliest step that is losing buyers, in this order. Each step limits the one after it, the same logic behind The Traffic to Sales Method.
Read the numbers side by side (Traffic to Sales Check). Put Shopify’s funnel, its sales by referrer and each tool’s own claims next to each other, and find where they disagree.
Get the right visitors (Get Found). Put your products and pages in front of people searching for them on Google.
Make each product page answer the buyer. Price, total cost, delivery date, size and proof from real customers, near the add to cart button.
Remove surprises at cart and checkout. Shipping costs shown early, guest checkout on, and the payment methods your buyers expect.
Follow up and prove it (Get Names, Get Orders, Show Proof). Collect email addresses, send the flows that bring visitors back to buy, and count the result in Shopify’s own reports.
Many CRO checklists start at step four, with buttons, badges and countdown timers. Those are the easiest changes to make, and they cannot rescue a shop whose visitors were never going to buy. For the wider plan, see how to increase sales on Shopify without more ad spend.
Will an app fix a low conversion rate?
Only if it fixes the step your reports say is losing buyers. An app adds a feature. It cannot tell you which step is broken, and it can cost speed on the pages it loads on.
If you have added the badges, the timers and the new photos and the number has not moved, that is not a failure of effort. Those changes were aimed at a step that was not the one losing buyers.
Speed is part of the price even for well-built apps. Shopify’s Built for Shopify requirements say an app must not reduce the storefront Lighthouse performance score by more than ten points, so an app can meet that standard and still slow the page a little. Before you install one, answer three questions:
Which step does it fix? Name it in the Conversion rate breakdown: cart additions, reaching checkout or completing it.
What is that step’s number today? Write it down with the dates.
What happens to sales per visit? Check it a month after the app goes live, in Shopify’s reports rather than the app’s dashboard.
Removing an app does not always undo it. Shopify’s help center on uninstalling apps says some apps add code to your online store theme that is not automatically removed when you uninstall them. Keep a note of what each app changed, so the theme can be cleaned up when the app goes.
How do product pages increase conversions?
By answering, on the page, every question that would otherwise send the buyer back to Google. Baymard’s product page research notes that nearly all shoppers go through a product page before deciding whether to buy, so this is where most of the persuading happens.
In Baymard Institute’s cart abandonment research (updated September 22, 2025), extra costs such as shipping, tax and fees led the reasons US shoppers gave for abandoning orders, at 40 percent, once shoppers who were just browsing are set aside. Another 12 percent could not see or calculate the total order cost up front, and 20 percent said delivery was too slow. Put the shipping cost, or a clear estimate, and a delivery date near the add to cart button.
Use social proof you can verify
Reviews carry real weight. Northwestern University’s Spiegel Research Center found the purchase likelihood for a product with five reviews was 270 percent greater than for one with none, in research first published in 2017. It also found purchase likelihood usually peaks at ratings between 4.0 and 4.7, so a page of perfect scores can look too good to be true.
“Not responding to negative reviews leaves users with a doubly bad impression.”
A reply takes minutes, and it shows the next buyer that someone is listening.
Keep your social proof honest. The FTC’s final rule banning fake reviews and testimonials, announced August 14, 2024, lets the agency seek civil penalties against knowing violators. It also bars a business from implying the reviews it shows are all or most of them when negative ones were suppressed.
Answer the questions a salesperson would
Size, materials, what is in the box, how it is used, when it arrives and what happens if it does not suit. The product description examples walk through the pattern. The same answers are what buyers type into Google, so this content helps the page get found as well as sold.
Does Shop Pay increase conversions?
Shopify says it does. Its Shop Pay page promises: “As much as 50% better conversion compared to guest checkout.” That is the company’s own figure about its own product, so treat it as a claim. Stores that use Shopify Payments get Shop Pay automatically, with no additional fees, so the practical step is to confirm it is on and visible.
What else in checkout is worth checking?
Checkout design is mostly Shopify’s job, which is good news: most of the flow is built and tested for you. A few settings are still yours, they shape the checkout experience, and they are where you can still trip buyers up:
Do not force accounts. In Baymard’s checkout research, a survey of 1,026 US adults, 18 percent had abandoned an order because they did not want to create an account. In Shopify, go to Settings, then Checkout, and leave “Require customers to sign in to their account before checkout” off unless you truly need it. Shopify’s help center notes that when it is on, accelerated checkout options such as Apple Pay are not displayed in the cart.
Offer the payment options your buyers expect. In the same research, 9 percent of those who abandoned said there were not enough payment methods.
Show a delivery date, not a delivery speed. Baymard found 48 percent of the sites it benchmarked still display a speed, such as 4 to 7 business days, instead of a date.
Does page speed affect conversion rates?
Yes, and the effect lands in money, not only in scores. Milliseconds Make Millions, a study commissioned by Google and run by 55 and Deloitte across 37 brand sites in late 2019, tracked what a 0.1 second improvement across four mobile speed metrics did. Retail shoppers moved from product page to basket 9.1 percent more often and spent 9.2 percent more.
Google’s Core Web Vitals set the targets: Largest Contentful Paint within 2.5 seconds, Interaction to Next Paint of 200 milliseconds or less, and Cumulative Layout Shift of 0.1 or less, measured at the 75th percentile of page loads. Shopify’s web performance reports track all three from real visitors, under Analytics, then Reports.
The guide to Shopify speed optimization covers what slows a site down and which page load improvements are worth the effort. The target is a mobile experience where the product, the price and the button appear before the buyer loses interest.
One more trap that feels like speed: pop-ups. Google’s guidance on intrusive interstitials says they may frustrate visitors and erode their trust in your website, and suggests banners that take up a small part of the screen instead. A sign-up form that covers the product on a phone interrupts the buyer at the exact moment of decision.
Which Shopify theme converts best?
No theme is proven to convert best across stores, because a theme demo cannot tell you how your products and your traffic will behave. What the platform does publish is a floor. Its Theme Store requirements say themes must have a minimum average Lighthouse performance score of 60 across product, collection and home pages, and an accessibility score of 90, on desktop and mobile.
Pick a Shopify theme for fast product pages on a phone, clear variant pickers and room for the details buyers need. Then judge any switch the way you judge everything else: sales per visit before and after, in Shopify’s own reports.
Should a small shop run A/B tests?
Usually not yet. A/B testing splits visitors between two versions of a page and compares them, and it needs far more traffic than most small stores get.
As of September 2026, Shopify can run that split itself. Its Rollouts feature, under Markets, then Rollouts, can turn a theme change into an experiment for a share of visitors, and Shopify’s help center says a store must be on the Grow plan or higher to run experiments.
For theme experiments, the rollout analytics list four measures: conversion, bounce, reached checkout and add to cart rates. Sales and AOV are not on that list, so a test can crown a winner that earns less per visit.
Then there is sample size. At a 1 percent conversion rate, spotting a lift to 1.2 percent takes about 39,600 sessions for each version by Evan Miller’s rule of thumb, and his sample size calculator also counts per variation. That is nearly 80,000 sessions for a simple two-version test, so a shop with 7,500 sessions a month would wait more than ten months.
“Decide on a sample size in advance and wait until the experiment is over”
Checking a test every morning and stopping it the day it looks good is the mistake his article warns against. If you have a team, agree the sample size and the end date before the test starts. Below the traffic a test needs, a better testing strategy is to fix the clear problems and compare before and after in your own reports.
How do you know a CRO change worked?
Compare the same stretch of time before and after in Shopify’s own reports, and check conversion, AOV and sales per visit together. Write down the before numbers and keep them saved before you change anything, so nobody has to reconstruct them later.
Use windows of the same length, and note season, sales and ad changes in both.
Split by channel. Total sales by referrer tells you which source each sale came through. A jump in Google or email traffic can move the whole site’s numbers on its own.
Do not grade a tool by its own dashboard. For August 17 to September 15, 2026, one store’s Klaviyo account credited email with 23 orders, while Shopify’s Total sales by referrer report traced 10 to an email click. Both are defensible; they count differently. Know which one you are reading.
Say what the numbers do not prove. One month, one store and small numbers can all mislead. A result that holds for two or three months is worth more than one great week.
This is the Show Proof stage, and it is where most customer experience projects fall apart. The change ships, nobody checks it against the real numbers, and the next idea replaces it. The key question every time is the same: did sales per visit improve, by Shopify’s count?
What does Shopify conversion rate optimization look like when it works?
It looks like more money from every visit, not a prettier percentage. The funnel report shows no single step where buyers pile up. Each product page answers the questions before anyone has to ask, with real reviews and other social proof close to the button.
Checkout finishes what the page started, and email brings back the people who were not ready yet. Most of all, the numbers agree: Shopify’s own reports, not an app’s dashboard, report sales per visit rising and staying up month after month.
That is what Shopify conversion rate optimization is for: a store that earns more from the traffic it has, instead of paying for every extra sale. To see where your own store loses buyers, the free Traffic to Sales Check reads Shopify, Google and email side by side. A Shopify store audit does the same work inside your accounts, and the case study has the before and after on one store.
The proof, from one store
Straight from the case study, with the source and what it does not prove. See all five results.
Result 1 · Sales
Total sales: $9,110 to $23,532 in about 90 days
Before the work$9,110
→
About 90 days in$23,532
2.6x
Baseline: the 30 days before the work began
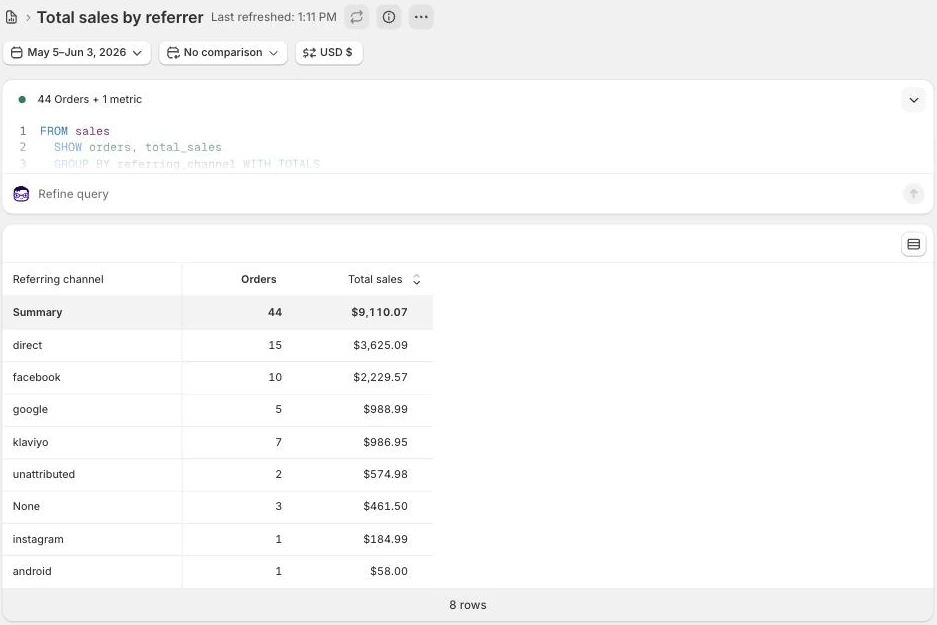
$9,110 in sales from 44 orders, May 5 to June 3, 2026: the 30 days before the work began on June 4, 2026. Google and email brought in 15% of it.
The work: what changed
Rewrote product names, page titles, descriptions and the text Google shows in search results around what buyers search for, with real weights (August 7 to 30). Built six city landing pages (August 1 and 2). Published the highest-value products to Google (August 24). Put welcome, abandoned cart and browse abandonment emails live (July 28) and replaced a weekly email that was not sending (September 4). Moved the Facebook budget to warm audiences (August 26).
Result: about three months in
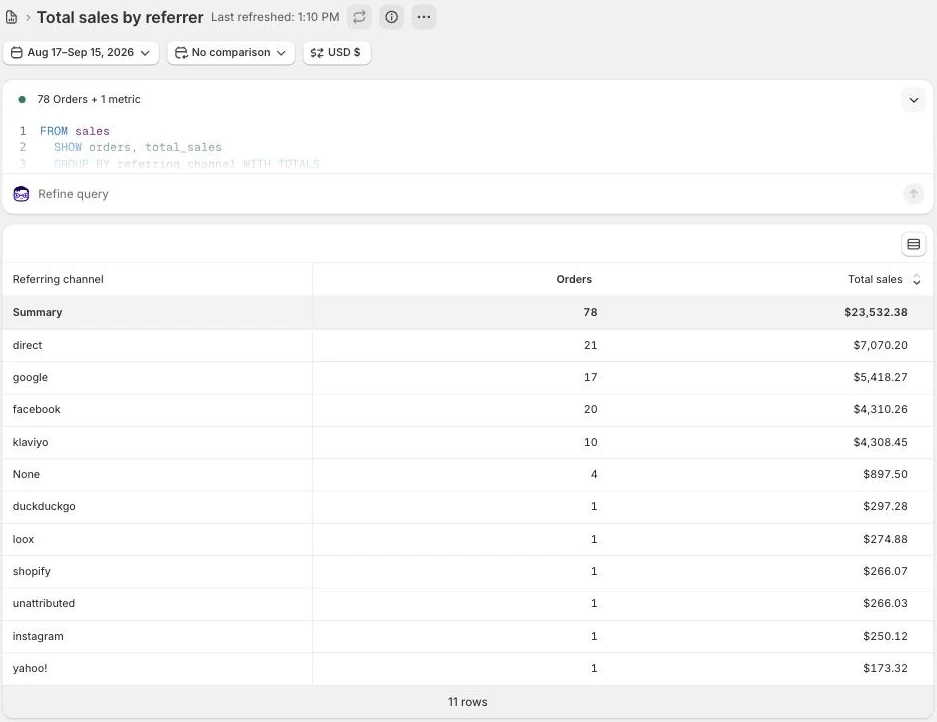
$23,532 in sales from 78 orders, August 17 to September 15, 2026, 2.6 times the baseline. Google and email brought in 41% of it.
Evidence source
Shopify Analytics, Total sales over time and Total sales by referrer, pulled September 18, 2026.Shopify’s Total sales by referrer report, grouped by referring channel, for the 30 days before the work began (May 5 to June 3, 2026). Store name redacted.The same report for the 30 days about three months in (August 17 to September 15, 2026). Store name redacted.
What this does not prove
This compares the 30 days before the work began with the 30 days about three months in, not an average. That is why every month is in the table below. The store's largest orders are seasonal deposit orders, and one September order made up $2,080 of the result. The Facebook ads ran in both periods.
Test it on your store
In Shopify, go to Analytics, then Reports, and open Total sales over time. Take the 30 days before your last big change and compare them with your most recent 30 days.
Want an ecommerce marketing agency to do this for your store?Ecommerce marketing for Shopify. On one store, a month of sales went from $9,110 to $23,532 in about 90 days. I work remotely with Shopify stores across the US.
Straight answers
Questions about this.
How do I get a better conversion rate on Shopify?
Find the step where most visitors drop out in the funnel report under Analytics and fix that step first. Usually that means better-matched traffic and product pages that show the full cost, a delivery date and real reviews. Then check guest checkout and payment methods, and judge every change by sales per visit to improve what the store earns.
What is a normal conversion rate on Shopify?
Littledata's 2023 benchmark of 2,800 Shopify sites put the average at 1.4 percent, with 1.2 percent on mobile and 1.9 percent on desktop. Above 3.2 percent put a site in the top 20 percent. Your own normal depends on price point, traffic sources and how many buyers already know you.
Is a 1% conversion rate bad on Shopify?
Not on its own. It is below Littledata's 1.4 percent average for Shopify sites in 2023, so there is room to improve. But one store converted about 1 in 100 visits both before and after its work, by Shopify's reports, while its sales per visit rose 39%. Check what each visit earns first.
Is a 2.5% conversion rate good?
For a Shopify site, yes. It is well above Littledata's 1.4 percent average from 2023, though below the 3.2 percent that marked the top 20 percent. Check sales per visit too, because 2.5 percent of visits buying small orders can earn less than 1.5 percent buying large ones.
Is a 12% conversion rate on a website good?
For an online store it is far above the published benchmarks, so check the measurement first. Shopify only counts sessions from visitors who accept cookies through the cookie banner, and bot traffic changes the count too. A small shop selling mostly to returning customers can also post a high number that will not hold.
Which Shopify theme has the best conversion rate?
No theme is proven to convert best across stores. Shopify's Theme Store requires a minimum average Lighthouse performance score of 60 and an accessibility score of 90, so listed themes clear a floor. Choose one that loads product pages fast on a phone, then compare sales per visit before and after a switch.
What does CRO mean on Shopify?
CRO stands for conversion rate optimization: raising the share of visits that end in an order. On Shopify, conversion rate is sessions that completed checkout divided by all sessions. Good CRO also watches order size and sales per visit, because more buyers placing smaller orders can earn less money overall.
Why is Shopify's conversion rate different from my own math?
Because Shopify divides sessions that completed checkout by all sessions, not orders by visitors. Bot sessions count unless you filter to human traffic, which can pull the figure down, and sessions only count visitors who accept cookies. Use the same dates and the same definition before you compare the two numbers.
Is Shop Pay worth turning on?
For most stores, yes. Shopify claims as much as 50 percent better conversion compared to guest checkout, which is the company's own figure, not an independent test. Stores that use Shopify Payments get Shop Pay automatically with no additional fees, so the practical step is to confirm it is switched on and visible at checkout.
How long should an A/B test run?
Until it reaches a sample size you set in advance, which for most small stores means months. At a 1 percent conversion rate, spotting a lift to 1.2 percent takes about 39,600 sessions per version by Evan Miller's rule of thumb. Below that traffic, fix clear problems and compare before and after instead.