Home / Case study
Case study · a direct to consumer store on Shopify

How one Shopify store grew its sales from $9,110 to $23,532 in about 90 days

Before the work $9,110
About 90 days in$23,532
2.6x · Source: Shopify

The ads were carrying this store. In about 90 days of work, Google and email went from 15% of its sales to 41%.

The short answer

A direct to consumer Shopify store sold $9,110 in the 30 days before the work began and $23,532 in the 30 days about three months in, by Shopify's own reports. The work turned on search, Google's free listings and Klaviyo email, and moved Facebook ads to warm audiences. It is one store, not a promise.

At a glance

What changed, and where does each number come from?

Before means the 30 days before the work began, May 5 to June 3, 2026. After means the 30 days about three months in, August 17 to September 15, 2026. The Facebook numbers compare cold audiences (August 3 to 25, 2026) with warm audiences (August 26 to September 15, 2026).

Screenshot of Shopify's Total sales by referrer report grouped by referring channel, August 17 to September 15, 2026: 78 orders and $23,532 in total, with the direct, google, facebook and klaviyo rows.Total $9,110 → $23,532Google $354 → $5,418Email $987 → $4,308
Shopify’s Total sales by referrer report for the 30 days about three months in (August 17 to September 15, 2026), store name removed. Each marked row shows the 30 days before the work (May 5 to June 3, 2026), then this report’s figure. Google before has three paid ad orders taken out.
The receipts

How was each result proven?

Every result shows the 30 days before the work began, what changed, the 30 days about three months in, where the number comes from, what it does not prove, and how to test your own store.

Result 1 · Sales

Total sales: $9,110 to $23,532 in about 90 days

Before the work$9,110
About 90 days in$23,532
2.6x
Baseline: the 30 days before the work began
$9,110 in sales from 44 orders, May 5 to June 3, 2026: the 30 days before the work began on June 4, 2026. Google and email brought in 15% of it.
The work: what changed
Rewrote product names, page titles, descriptions and the text Google shows in search results around what buyers search for, with real weights (August 7 to 30). Built six city landing pages (August 1 and 2). Published the highest-value products to Google (August 24). Put welcome, abandoned cart and browse abandonment emails live (July 28) and replaced a weekly email that was not sending (September 4). Moved the Facebook budget to warm audiences (August 26).
Result: about three months in
$23,532 in sales from 78 orders, August 17 to September 15, 2026, 2.6 times the baseline. Google and email brought in 41% of it.
Evidence source
Shopify Analytics, Total sales over time and Total sales by referrer, pulled September 18, 2026.
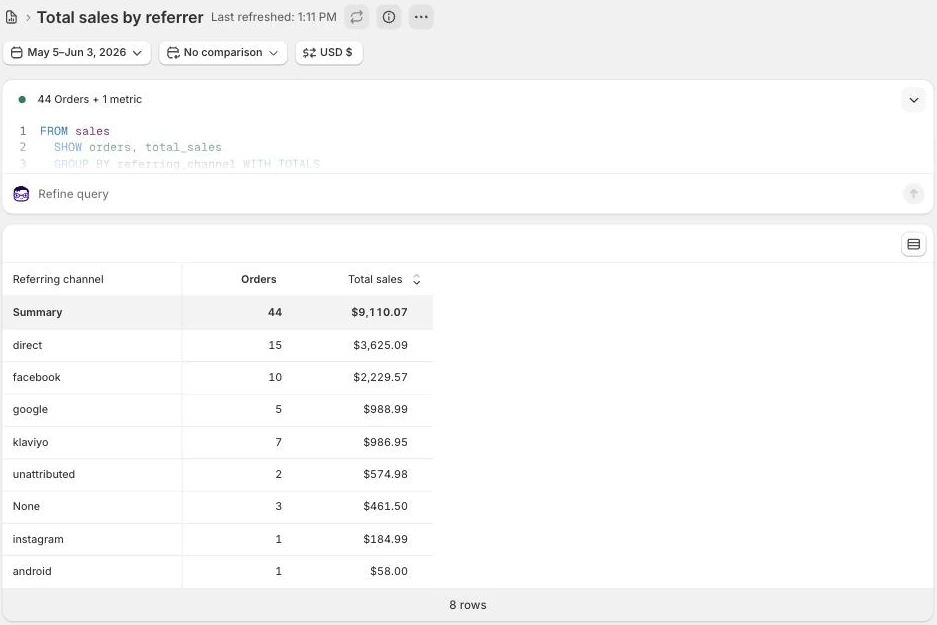
Screenshot of Shopify's Total sales by referrer report grouped by referring channel, May 5 to June 3, 2026: 44 orders and $9,110 in total, with the direct, facebook, google and klaviyo rows.
Shopify’s Total sales by referrer report, grouped by referring channel, for the 30 days before the work began (May 5 to June 3, 2026). Store name redacted.
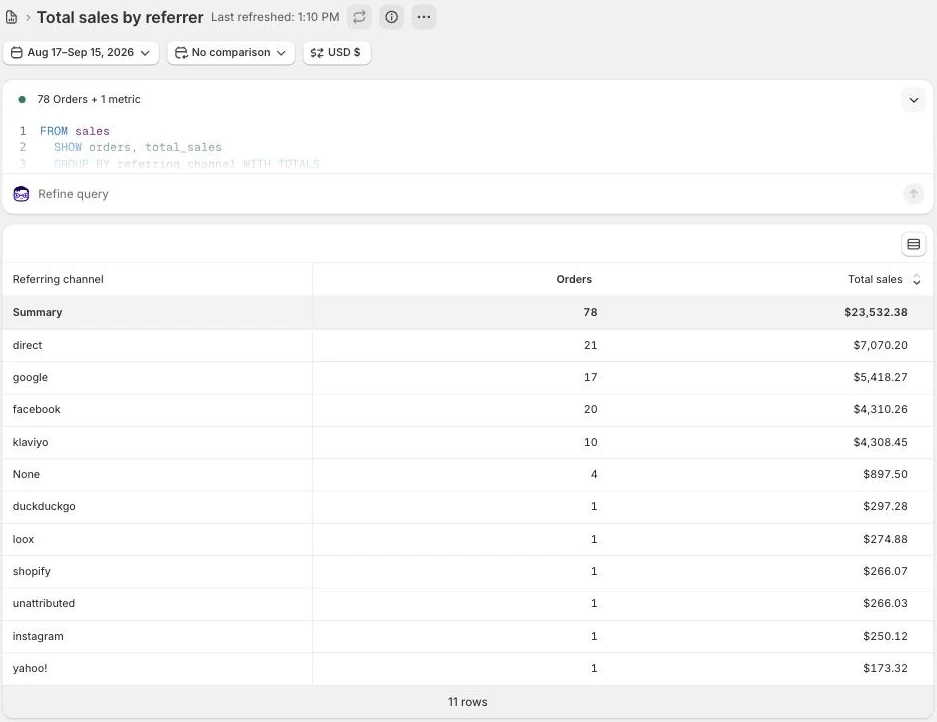
Screenshot of Shopify's Total sales by referrer report grouped by referring channel, August 17 to September 15, 2026: 78 orders and $23,532 in total, with the direct, google, facebook and klaviyo rows.
The same report for the 30 days about three months in (August 17 to September 15, 2026). Store name redacted.
What this does not prove
This compares the 30 days before the work began with the 30 days about three months in, not an average. That is why every month is in the table below. The store's largest orders are seasonal deposit orders, and one September order made up $2,080 of the result. The Facebook ads ran in both periods.
Test it on your store
In Shopify, go to Analytics, then Reports, and open Total sales over time. Take the 30 days before your last big change and compare them with your most recent 30 days.
Result 2 · Email

Sales from email: $987 to $4,308 in about 90 days

Before the work$987
About 90 days in$4,308
4.4x
Baseline: the 30 days before the work began
$987 from 7 orders that came in through an email, 11% of sales, May 5 to June 3, 2026.
The work: what changed
Built welcome, abandoned cart, browse abandonment, win-back and high-ticket follow-up emails in Klaviyo (live July 28). Found that the weekly email only went to people who joined the list after it was switched on, so it reached 13 people in six weeks. Replaced it with a scheduled weekly email (September 4) that reached 484 people on its first send (September 8).
Result: about three months in
$4,308 from 10 orders that came in through an email, 18% of sales, August 17 to September 15, 2026, 4.4 times the baseline.
Evidence source
Shopify Analytics, Total sales by referrer, Klaviyo row, pulled September 18, 2026.
What this does not prove
One deposit order, worth $2,080, was placed 17 minutes after the buyer clicked a welcome email. Without it, email brought in $2,228, still 2 times the baseline. Klaviyo credits email with more, 23 orders for the same dates, because it counts any order placed within days of someone opening or clicking an email.
Test it on your store
In Klaviyo, open each flow and compare recipients over the last 30 days with the size of the list it should reach. Then open Total sales by referrer in Shopify for the same 30 days and find the Klaviyo row. A flow reaching a fraction of its list, or a Klaviyo row near zero, is the place to start.
Result 3 · Google

Sales from Google: $354 to $5,418 in about 90 days

Before the work$354
About 90 days in$5,418
15x
Baseline: the 30 days before the work began
$354 from 2 orders that came in from Google, May 5 to June 3, 2026. The highest-value products in the catalog had never been published through the store's Google channel.
The work: what changed
Rewrote product names, titles, descriptions and search snippets around the terms buyers search, with real weights (August 7 to 30). Built six city landing pages (August 1 and 2). Published the store's highest-value products to the Google channel so they could show in free Shopping listings (August 24). Cleaned up crawl errors and expanded thin product pages to more than 400 words (August 27 to 30).
Result: about three months in
$5,418 from 17 orders that came in from Google, August 17 to September 15, 2026, 15 times the baseline.
Evidence source
Shopify Analytics, Total sales by referrer, Google row, pulled September 18, 2026.
What this does not prove
Shopify does not split Google search from free Shopping listings, so this cannot say which sold more. Four of the 17 orders were deposit orders, worth $2,070. Google Search Console only started collecting data on July 28, 2026, so there are no clicks from before the work to compare.
Test it on your store
In Shopify, open the Google and YouTube channel and check that your best sellers are published to it. In Search Console, open Performance, sort queries by impressions, and note the ones in positions 5 to 15. Then compare the Google row in Total sales by referrer for your most recent 30 days with the 30 days before your last change.
Result 4 · New customers

First-time buyers: 25 to 53 in about 90 days

Before the work25
About 90 days in53
2.1x
Baseline: the 30 days before the work began
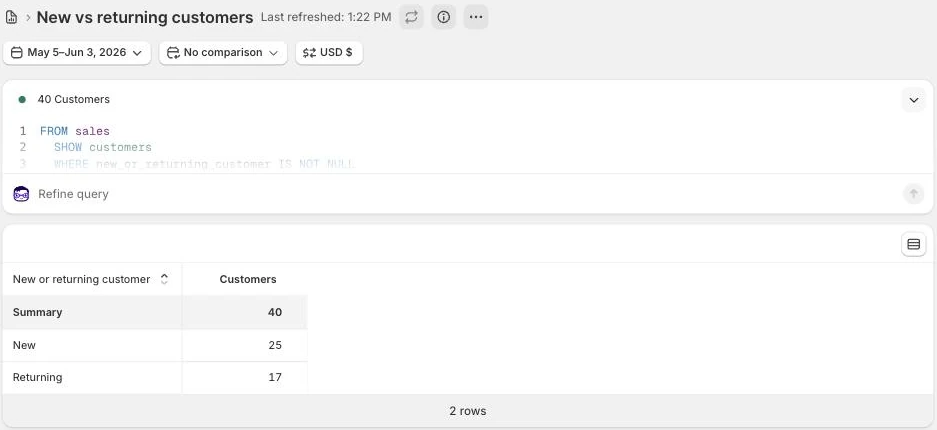
25 first-time buyers, May 5 to June 3, 2026.
The work: what changed
The same work, aimed at people who had never bought: product and city pages written the way new buyers search, the highest-value products on Google, a welcome email that sends, and Facebook ads shown to people who had already visited or engaged.
Result: about three months in
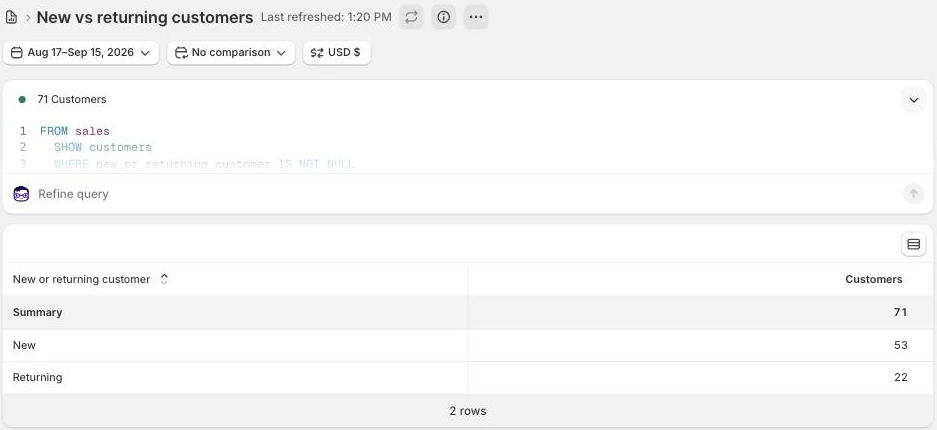
53 first-time buyers, August 17 to September 15, 2026, 2.1 times the baseline.
Evidence source
Shopify Analytics, orders by new or returning customer, pulled September 18, 2026.
Screenshot of Shopify's New vs returning customers report for May 5 to June 3, 2026: 25 new customers.
Shopify’s New vs returning customers report for the 30 days before the work began (May 5 to June 3, 2026). Store name redacted.
Screenshot of Shopify's New vs returning customers report for August 17 to September 15, 2026: 53 new customers.
The same report for the 30 days about three months in (August 17 to September 15, 2026). Store name redacted.
What this does not prove
Shopify counts a buyer as new on their first order in this store, which opened in October 2025, so someone who bought from the brand another way before then still counts as new.
Test it on your store
In Shopify, open Total sales over time for your last 30 days and group it by new or returning customer. Do the same for the 30 days before the change. If new customers stay flat while ad spend climbs, the ads are mostly reaching people who would have bought anyway.
Result 5 · Facebook

Facebook: 45¢ to 13¢ a visit, and 10 times the checkouts per visit

Cold, Aug 3 to 25, 20261 in 1,793
Warm, Aug 26 to Sep 15, 20261 in 179
10x
Baseline: cold audiences, before the switch
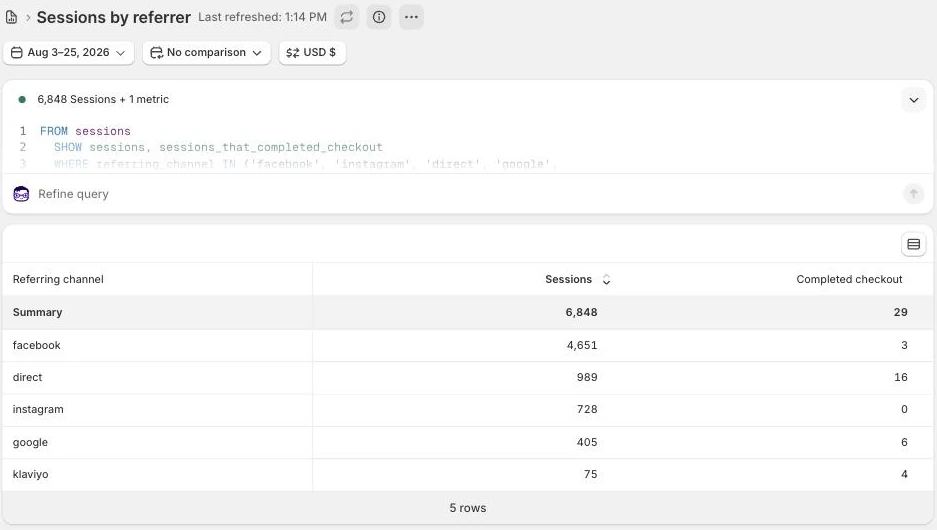
Cold-audience campaigns, August 3 to 25, 2026: 45¢ per website visit. Shopify logged 5,379 visits from Facebook and Instagram and 3 completed checkouts, 1 in 1,793 visits.
The work: what changed
Moved the budget to warm audiences, people who had already visited the store or engaged with the brand, with a single box offer (from August 26).
Result: warm audiences, after the switch
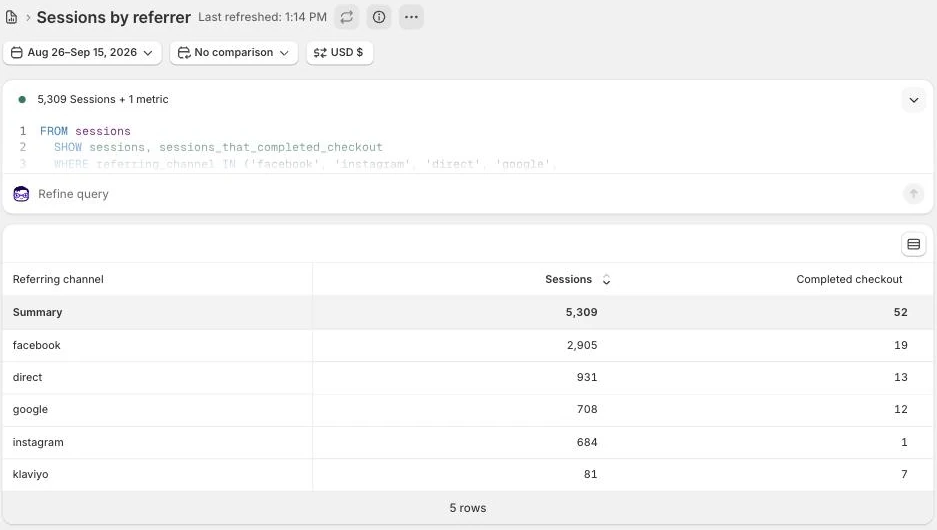
13¢ per website visit, 71% less. Shopify logged 3,589 visits from Facebook and Instagram and 20 completed checkouts, 1 in 179 visits, 10 times the rate on cold audiences.
Evidence source
Screenshot of Shopify's Sessions by referrer report, August 3 to 25, 2026, filtered to five channels: facebook 4,651 sessions and 3 completed checkouts, instagram 728 and 0.
Shopify’s Sessions by referrer report for the cold-audience weeks (August 3 to 25, 2026), filtered to five channels: facebook and instagram together, 5,379 visits and 3 completed checkouts. Store name redacted.
Screenshot of Shopify's Sessions by referrer report, August 26 to September 15, 2026, filtered to five channels: facebook 2,905 sessions and 19 completed checkouts, instagram 684 and 1.
The same report for the warm-audience weeks (August 26 to September 15, 2026): 3,589 visits and 20 completed checkouts. Store name redacted.
Cost per visit: Facebook Ads Manager. Visits and checkouts: Shopify Analytics, sessions by referrer with completed checkouts, pulled September 18, 2026.
What this does not prove
Both periods fall inside the work, so this proves the switch, not a gain over the ads that ran before June. Facebook visits have converted anywhere from 1 in 71 (March 2026) to 1 in 811 (December 2025). Warm audiences are smaller and wear out, and Shopify's Facebook visits include unpaid posts. The periods are 23 and 21 days.
Test it on your store
In Shopify, open Sessions by referrer and Total sales by referrer for your last 30 days, and divide Facebook's orders by its sessions. In Ads Manager, compare cost per landing page view on cold ad sets and retargeting ad sets. Thousands of visits and a handful of orders means the ads are buying visits, not buyers.

The weekly email said live. Who did it reach?

BEFOREthe flow that was live in name only reached 13 of 488AFTERthe first scheduled weekly email reached 484 of 488BEFOREthe flow that was live in name only reached 13 of 488AFTERthe first scheduled weekly email reached 484 of 488

Same list. 37x the people reached.

Sales from email went from $987 to $4,308: 4.4x, the 30 days before the work against the 30 days about three months in.

One square per person on the list, from the store’s Klaviyo account. Rust squares received the email: 13 people in six weeks before, 484 on one send after.
Getting found

How did the store get found on Google?

Four places show it: live Google rank checks, Google Search Console (Google's report on how a site does in search), Google Merchant Center (where a store's products are sent to Google) and Shopify. Every chart and screen below comes from the store's own accounts or a live Google search, with the client's name and location removed.

Which searches does the store rank for now?

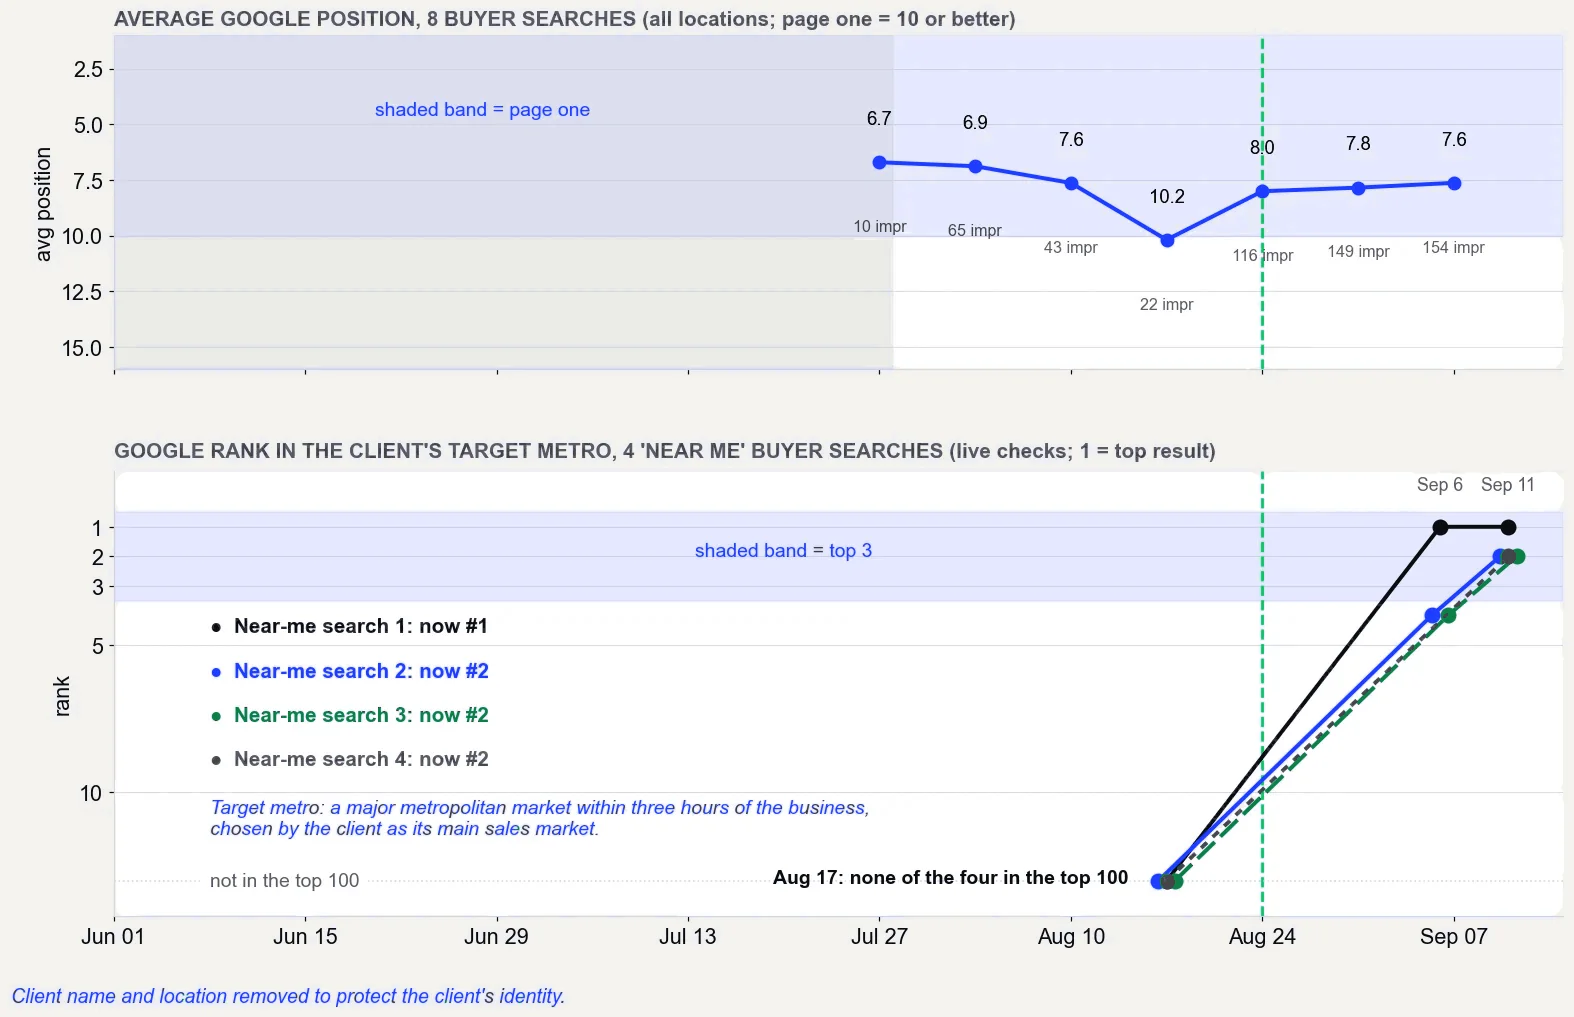
On August 17, 2026, none of four “near me” buyer searches in the store's target metro showed the store in Google's top 100. By September 11, one ranked #1 and three ranked #2, according to live Google rank checks.

#1for a “near me” search for the store’s highest-value product, in its target metroNot in the top 100 on August 17, 2026
#2for three more “near me” buyer searches thereNone of them in the top 100 on August 17, 2026
170 of 246“near me” searches on page one in the target metro45 in the top 3, checked September 11, 2026
29 of 30statewide searches for its highest-value products in the top 3Checked from five buyer cities, September 11, 2026
Chart: average Google position for eight buyer searches stayed on page one, and four near me buyer searches in the target metro went from outside the top 100 on August 17 to #1 and #2 by September 11, 2026.
Live Google rank checks on August 17, September 6 and September 11, 2026, and Search Console positions for eight buyer searches. The target metro is a major metropolitan market within three hours of the business, chosen by the client as its main sales market. What it does not prove: rankings change by location and by day, and the first rank check came after the work began.

What do those searches look like on Google?

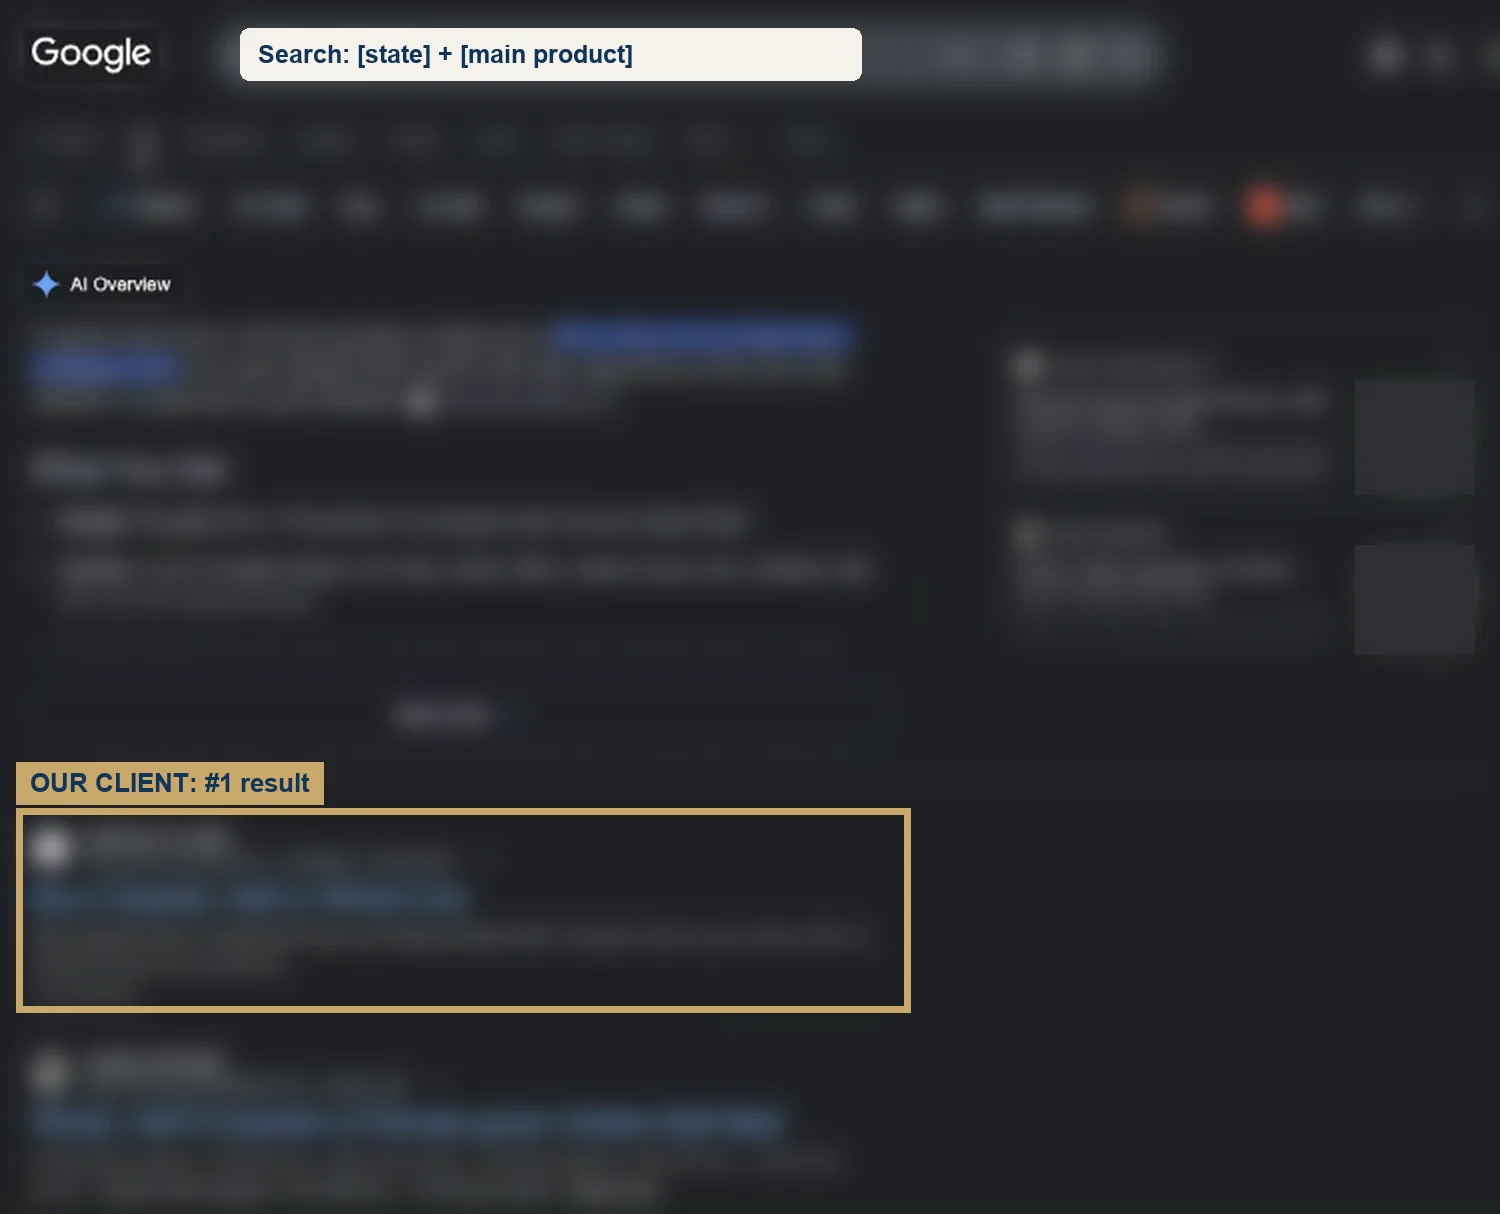
Blurred screenshot of a Google search for the state plus the store's main product, with the store marked as the number one regular result.
A statewide search for the store's main product: the #1 regular result.
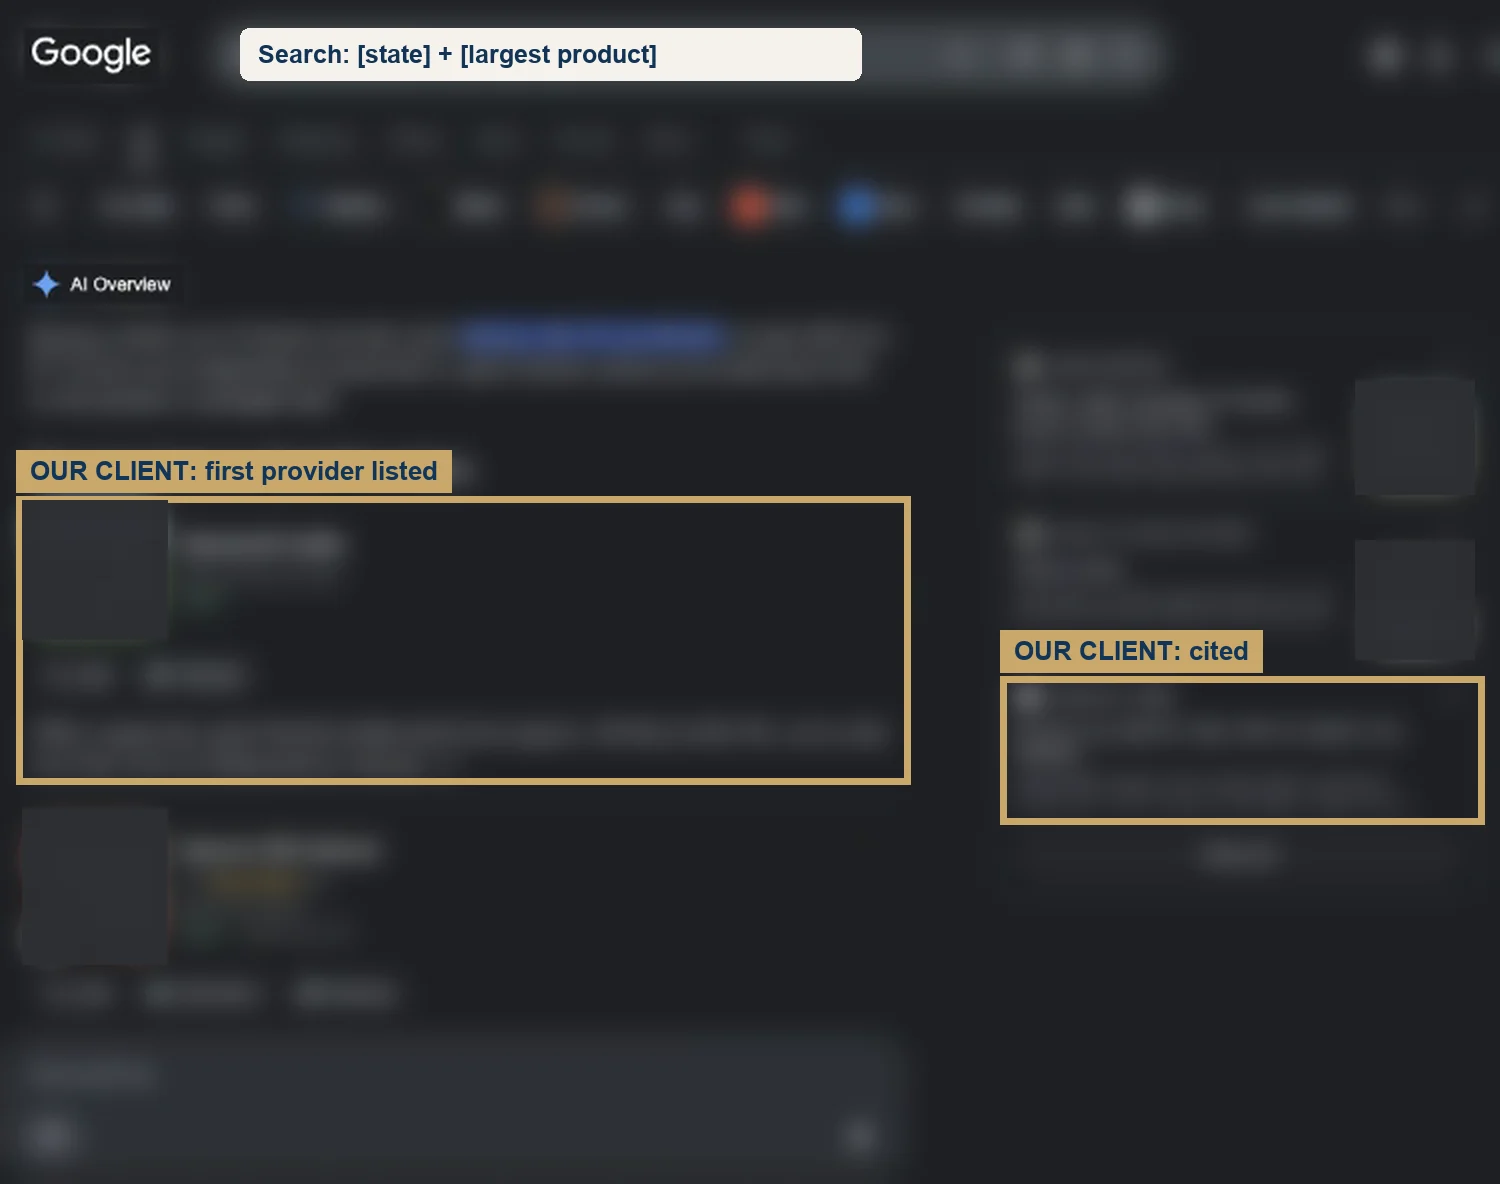
Blurred screenshot of a Google search for the state plus the store's largest product, with the store marked as the first provider listed and as a source cited in the AI Overview.
A statewide search for its largest product: the first provider listed, and cited in Google's AI Overview.

Screens from a live Google search, recorded September 3, 2026. Names, places, photos and search words are blurred to protect the client.

Did more people click through from Google?

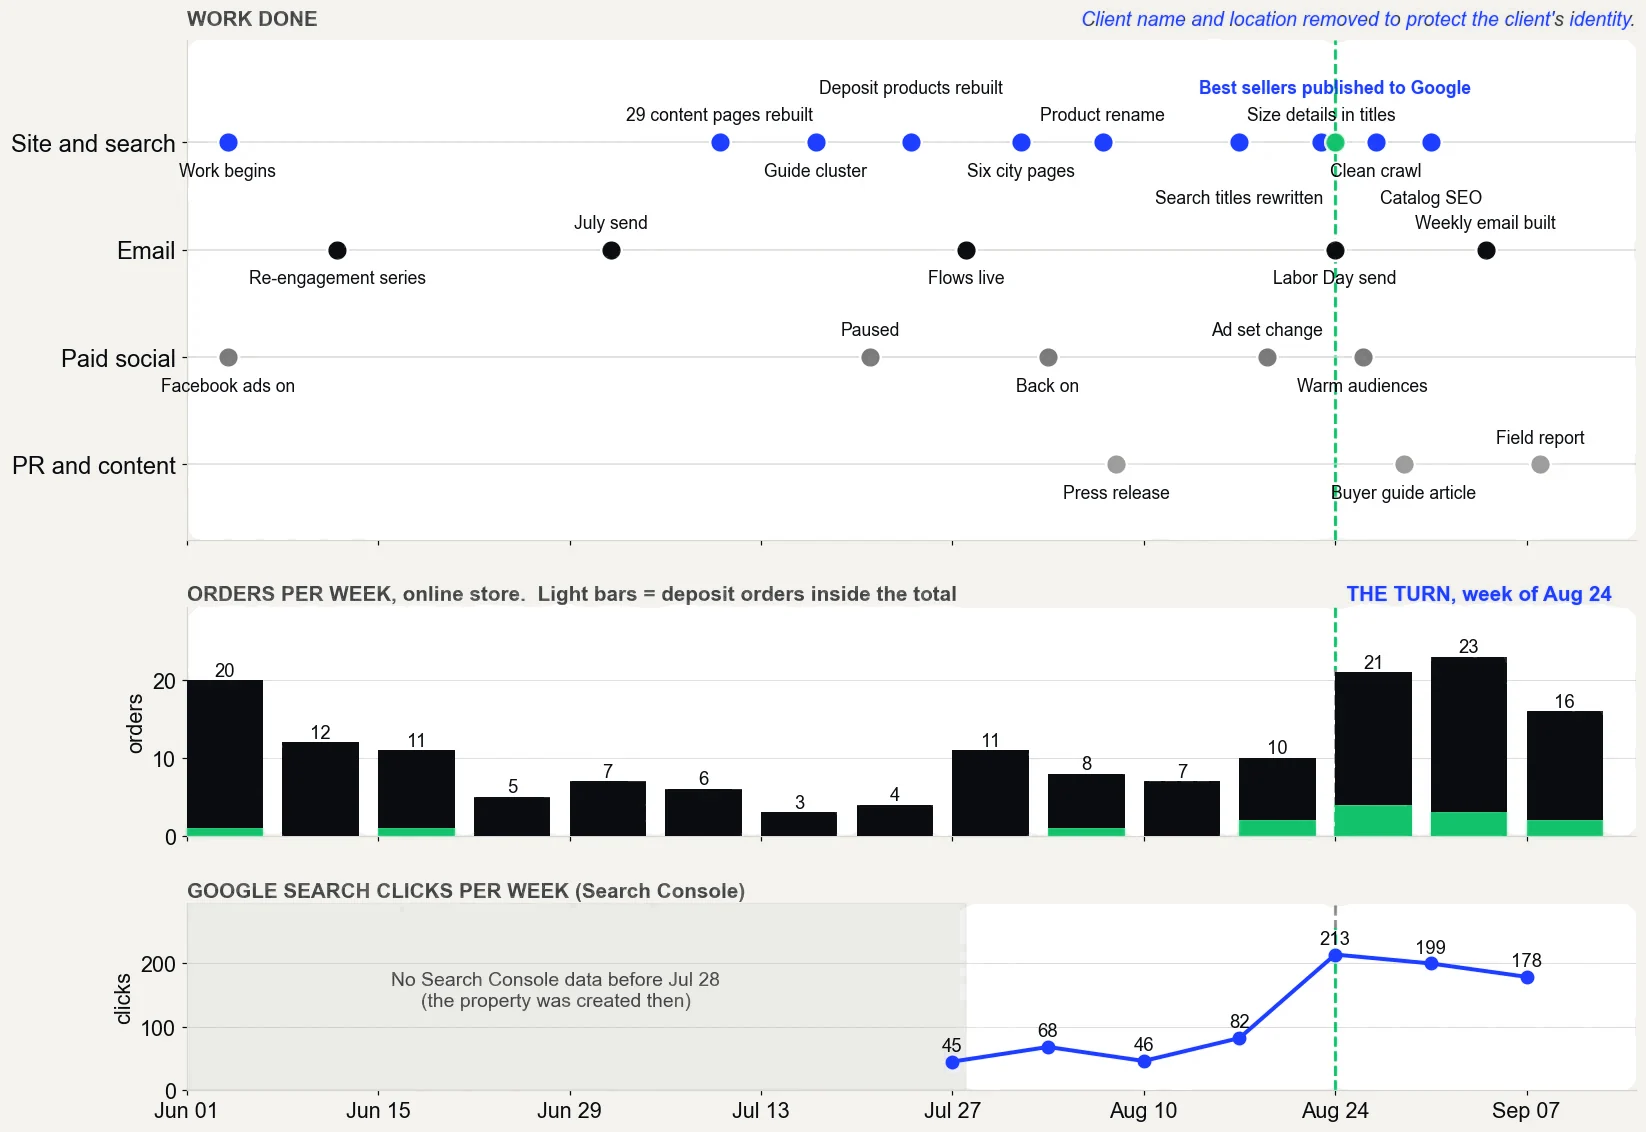
Before: 45 clicks from Google search in the week of July 27, 2026, the first full week Search Console recorded. After: 213 clicks in the week of August 24, and 178 in the week of September 7, according to Search Console.

Chart of the work done on the store week by week from June to September 2026, with orders per week and Google search clicks per week. Clicks rose from 45 in the week of July 27 to 213 in the week of August 24.
The work, week by week, against orders and Google search clicks. Sources: the store's online orders; Search Console, pulled September 14, 2026; project records for the work dates. What it does not prove: Search Console has no data from before July 28, 2026, and store orders leave out phone and pickup sales.

Did the free product listings get found?

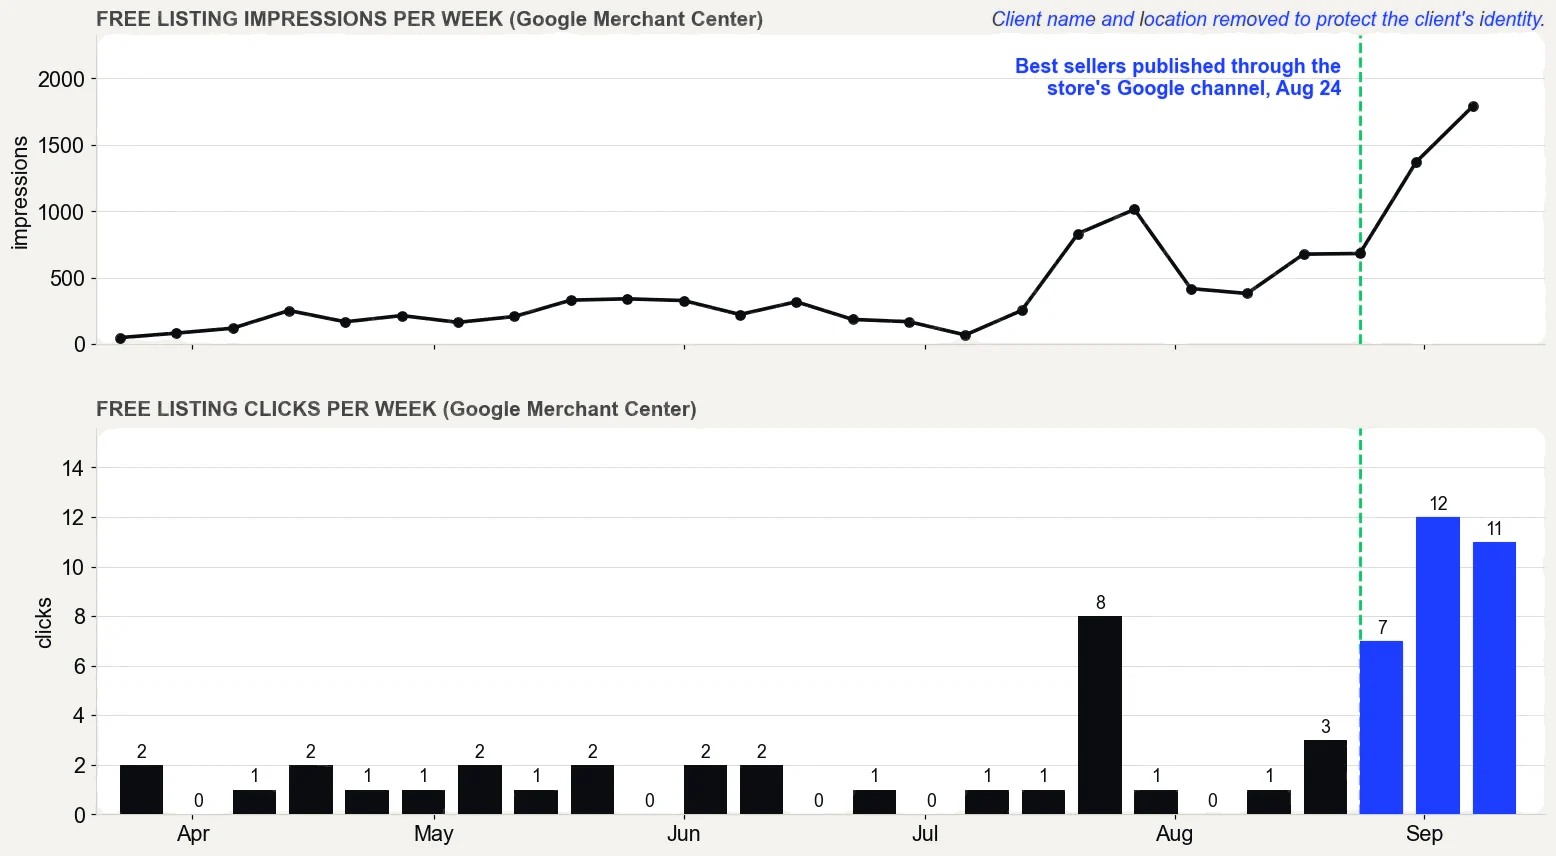
Before: 5 clicks and 562 impressions from Google's free listings in the 30 days before the work began, May 5 to June 3, 2026. After: 34 clicks and 5,026 impressions in the 30 days about three months in, August 17 to September 15, 2026, according to Merchant Center.

The three highest-value products had never been sent to Google from Shopify. Google showed incomplete versions it found on its own, which were shown 610 times and clicked 3 times in the 30 days to August 24. They were published properly on August 24, 2026, and in their first 22 days they were shown 1,567 times and clicked 10 times.

Chart of Google free listing impressions and clicks per week from March to September 2026, rising after the best sellers were published through the store's Google channel on August 24.
Google Merchant Center performance report, free listings only, pulled September 16, 2026. What it does not prove: the product pages were rewritten in the same weeks, so not all of the change comes from publishing, and free listing clicks are still small numbers.

Did orders from the target metro follow?

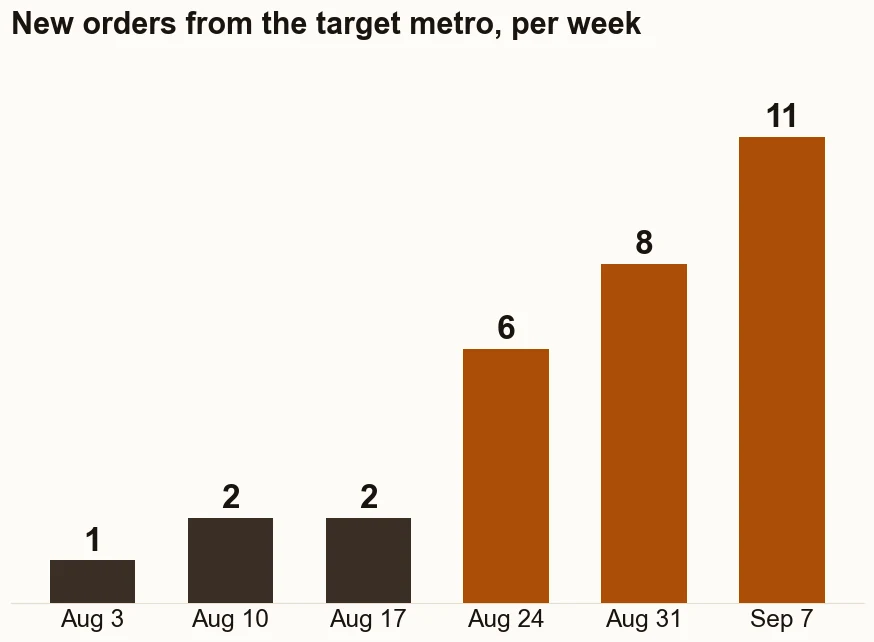
New orders from the target metro went from 1 in the week of August 3, 2026 to 11 in the week of September 7, counted by delivery address in Shopify.

Bar chart: new orders from the target metro rose from 1 in the week of August 3 to 11 in the week of September 7, 2026.
What it does not prove: none of the 35 metro orders from July 18 to September 14 started on the metro landing page, and 10 of the 31 new ones touched Google search along the way. The orders rose with the rankings; this does not show the rankings caused all of them.

Where did the buyers come from?

Shopify's own sales attribution report credits each order to the visit it came from. Here it compares the two biggest sources of visits.

Google search, not paid24 ordersfrom 1,720 visits: 1.4 percent bought
Paid Facebook and Instagram ads9 ordersfrom 9,214 visits: 0.1 percent bought

Google search brought in more than 3.5 times the sales of the paid ads, from under a fifth of the traffic.

Source: Shopify’s sales attribution report for the 90 days before September 3, 2026. Google search brought $8,316 in sales and paid Facebook and Instagram $2,322, as charged. What it does not prove: the report credits each order to the visit it came from, so an ad that first introduced a buyer who later searched Google gets no credit.

How can you check the same things on your store?

Open Search Console's Performance report for clicks, search your own buyer terms from the city you sell into, open Merchant Center's performance report for free listings, and open Shopify's sales attribution report to see which visits turn into orders.

Where it started

What was going wrong before the work?

Facebook was carrying the store

Before the work, the store paid $1,700 a month for Facebook: $1,200 in ad spend and $500 to an ad vendor. In the 30 days before the work began, May 5 to June 3, 2026, the whole store sold $9,110.

Google and email were barely on

In those 30 days, Google brought in $354 and email $987, 15% of sales between them. The highest-value products in the catalog had never been published through the store's Google channel.

Most visitors were strangers

In the 30 days to August 20, 2026, the store could identify about 0.8 percent of its visitors. That limited every email that depends on knowing who is browsing.

Checkout was not the problem

33 of the 41 people who started checkout finished in the 30 days to August 20, 2026, about 80 percent. The sales were being lost before checkout, not at it.

What was done

What was done, stage by stage?

01

Traffic to Sales Check

Shopify, Klaviyo, Google Search Console, GA4 and Google Merchant Center were read side by side. That is how three problems surfaced: top products that had never been published to Google, a weekly email that reached 13 people in six weeks, and Facebook visits that almost never bought.

Service Shopify store audit

02

Get Found

Product names, page titles, descriptions and the text Google shows in search results were rewritten around real searches (August 7 to 30). Six city landing pages went live (August 1 and 2). The highest-value products were published to Google (August 24). Sales from Google went from $354 in the 30 days before the work began to $5,418 in the 30 days about three months in.

Service Shopify SEO and Google Merchant Center

03

Get Names

The store can only email visitors it can identify, and it could identify about 0.8 percent of them. Sign-up forms went onto the city pages and the highest-value product pages on August 8.

Service Klaviyo email

04

Get Orders

Welcome, abandoned cart, browse abandonment, win-back and high-ticket follow-up emails went live July 28. On September 4, a scheduled weekly email replaced a sequence that was not sending. Sales from email went from $987 to $4,308.

Service Klaviyo email

05

Show Proof

Every figure comes from Shopify's own reports.

Service Shopify store audit reporting

What changed, and when

About 90 days of work on one store, June 4 to September 15, 2026. Every date is on the case study page. The shaded rows are the 30 days in the comparison.

  1. Work began
  2. Welcome, abandoned cart and browse abandonment emails put live
  3. Six city landing pages built
  4. Product names, page titles and descriptions rewritten around what buyers search for
  5. The 30 days in the comparison begin
  6. The highest-value products published to Google
  7. Facebook moved from cold audiences to warm ones
  8. The weekly email that was not sending, replaced
  9. The 30 days in the comparison end: $23,532 in sales, against $9,110 before the work
Month by month

What happened month by month, including the bad months?

Sales from Google, by month

0$2k$4k$6k$590Oct$1,545Nov$855Dec$900Jan$815Feb$374Mar$610Apr$0May$990Jun$970Jul$3,181Aug$5,295Sepwork began June 4
Organic search and free listings: Shopify credits each sale to Google; the store’s few paid Google orders (April to June) are taken out. Grey months are before the work, rust after. September is the whole month; the best sellers sold out in its last week.

Sales from email, by month

0$1k$2k$3k$4k$0Oct$0Nov$0Dec$2,450Jan$660Feb$1,311Mar$649Apr$581May$1,481Jun$150Jul$1,612Aug$3,195Sepwork began June 4
Shopify credits each sale to Klaviyo email. Grey months are before the work, rust after. September is the whole month; the best sellers sold out in its last week.
PeriodSalesOrders First-time buyersFrom emailFrom GoogleFrom Facebook
October 19 to 31, 2025 (store opens, partial month)$2,36899$0$590$194
November 2025$6,1872421$0$1,545$2,436
December 2025$5,9461510$0$855$710
January 2026$10,174197$2,450$900$1,538
February 2026$18,0613715$660$815$3,003
March 2026$14,5325536$1,311$374$3,678
April 2026$11,5253925$649$634$1,797
May 2026$8,1183822$581$635$2,048
June 2026 (work begins June 4)$10,9885030$1,481$1,802$2,306
July 2026$8,623266$150$970$1,600
August 2026$13,6435329$1,612$3,181$1,435
September 2026$26,3328355$3,195$5,295$4,425

Source: Shopify Analytics (ShopifyQL), every order from the store's first on October 19, 2025 through September 30, 2026, pulled October 4, 2026. Sales are Shopify's total sales. Email, Google and Facebook are the channels Shopify recorded for each order. The rest came in direct or from other sites.

What does this case study not prove?

  • Every Shopify figure on this page compares the same two 30-day windows: the 30 days before the work began (May 5 to June 3, 2026) and the 30 days about three months in (August 17 to September 15, 2026). Two windows are not an average, which is why every month is in the table.
  • July 2026 was the weakest month of the work, at $8,623. The ads were paused from July 21 to August 2, and no email campaign went out after July 2.
  • The Facebook ads were paused once and never shut off. They moved to warm audiences on August 26, 2026.
  • Klaviyo credits email with 23 orders from August 17 to September 15, 2026. Shopify traces 10 orders to an email click. This page uses Shopify's count.
  • September 2026 was the store's best month on record, at $26,332. Its best sellers sold out in the last week of the month, so those days show what was left to sell, not demand.
  • One store is not a promise. Each result above includes a way to test whether the same gap exists in yours.
Straight answers

Questions about this case study.

How much did sales grow for the store in this case study?

The 30 days before the work began, May 5 to June 3, 2026, brought in $9,110. The 30 days about three months in, August 17 to September 15, 2026, brought in $23,532, by Shopify's own reports. Those are the 30 days before the work and the 30 days about three months in, not averages, and the monthly table shows every month.

Where did the growth come from?

Mostly organic traffic from Google, and email. In the 30 days about three months in, email brought in $4,308 and Google $5,418, 41% of sales together, up from 15% in the 30 days before the work began.

Did the store stop running Facebook ads?

No. The ads moved from cold to warm audiences on August 26, 2026. A website visit cost 13¢ instead of 45¢ in Facebook Ads Manager, and in Shopify 1 in 179 Facebook and Instagram visits completed checkout instead of 1 in 1,793.

Is this a typical result?

No. It is one store. Each result shows what happened there, where the number comes from and what it does not prove, with a way to test whether the same gap exists in your store.

What was the worst month during the work?

July 2026, at $8,623. The ads were paused from July 21 to August 2 and no email campaign went out after July 2. It is in the monthly table on purpose.

Why is the client not named?

Client names are never published without permission. Every number comes from the store's own Shopify reports, and the monthly table shows every month from the day the store opened.

How long did it take to see results?

The work began June 4, 2026. The later 30 days ran August 17 to September 15, 2026, about three months in. July was the weakest month of the work, so the path was not a straight line.

Could your store look like this?

Thirty minutes. I will tell you honestly where your traffic is losing sales.

Prefer email? herbert@herberttimpson.com

Book a callFree check