Home / Insights / Shopify analytics: which reports show where sales come from
Sales · 16 min read
Shopify analytics: which reports show where sales come from
Your Shopify dashboard, your email platform and your ad account each tell a different story about the same month, and none of them feels complete. Here is which Shopify reports to trust, how to read them, and what they cannot prove.
The short answer
Shopify analytics is the dashboard and set of reports inside your Shopify admin. Three reports show where the money really comes from: Total sales over time, Total sales by referrer and Sessions by referrer. Read them before any app's dashboard. On one store, Klaviyo credited email with 23 orders while Shopify traced 10 to an email click.
Shopify analytics is the set of dashboards and reports built into every Shopify store. You open it from Analytics in your Shopify admin. It answers the questions every business owner has at the end of a month: what sold, how many people visited, and which channels brought the buyers.
The Analytics dashboard: a page of metric cards, such as sessions by device type. It opens on the last 90 days and is up to date within about a minute, according to Shopify’s guide to using the Analytics overview dashboard.
Reports: a graph plus a table for one set of metrics, grouped into categories such as Acquisition, Marketing and Inventory.
Live View: a map of what is happening on the store right now.
What sets it apart from every other dashboard you use: Shopify records the orders themselves. Your email platform, your ad account and Google Analytics each report on their own share of the credit. Shopify is where the orders actually land.
Where do you find Shopify reports?
From your Shopify admin, go to Analytics, then Reports. Click the Category filter to narrow the list to Acquisition, Sales, Marketing or another group. A few facts about Shopify reports save a lot of confusion:
Default reports are built by Shopify. Filter the list by Created by, then Shopify, to see only those.
Every report is a query. Shopify’s overview of the new reports explains that each default report shows a pre-written ShopifyQL query, so you can read exactly how its metrics are built.
Edits are temporary until you save. A change to a default report does not override it. Save the exploration as a custom report to keep it, which you can do regardless of your plan.
Tables stop at 1,000 rows on screen. Shopify’s reports guide says totals still cover every row, and you can export the full report.
Sidekick, Shopify’s built-in AI assistant, can also build a report from a plain-language request. Check the query it writes before you trust the answer, the same way you would check a new hire’s spreadsheet.
Which Shopify reports show where sales come from?
Three of them. Together they answer three questions: how much the store sold, which site sent each buying visit, and how many visits each site sent. Read them in this order:
Report
The question it answers
What it cannot tell you
Total sales over time
How much did the store take, and how many orders, by day, week or month?
Where the buyers came from
Total sales by referrer
Which site sent the visit that placed each order?
Earlier visits from other channels, because it shows the last interaction
Sessions by referrer
How many visits did each site send?
Orders or revenue; acquisition reports show visitors only
Conversion summary, on each order
What did this one buyer do before ordering?
Totals across the store
Shopify documents the first two with its sales report definitions and the third with its acquisition reports. Put the referrer reports side by side and you get the performance figure ad dashboards leave out: how many visits each channel needs to produce one order.
What is the difference between gross, net and total sales?
Each figure builds on the one before. Gross is the price of what you sold before anything comes off, net takes out discounts and reversals, and total adds back what customers paid on top. Shopify defines all three in its glossary:
Metric
How Shopify builds it
Use it when
Gross sales
Product price times quantity, before taxes, shipping, discounts and reversals
You want the size of demand before discounts
Net sales
Gross minus discounts and reversals
You compare Shopify with a tool that leaves out shipping and tax
Total sales
Net plus taxes, duties, shipping charges and fees
You want what customers were charged, the headline figure
A sales reversal is any order adjustment with a negative value: a return, a cancellation, an edit, or an adjustment to shipping, taxes, fees or discounts. Pending, unpaid and canceled orders are included. Test orders are not, and deleted orders disappear from the reports entirely.
Two more rules catch owners out. These reports track the value of goods sold, not the money that has reached your bank. Chargebacks are not included either, so for cash, use the payments finance reports.
How do you read the Total sales by referrer report?
It lists revenue by the site that sent the buying visit. Shopify groups each referrer as Direct, Search, Email, Social or Unknown, and the report shows the last interaction referrer: the site the customer used just before placing the order.
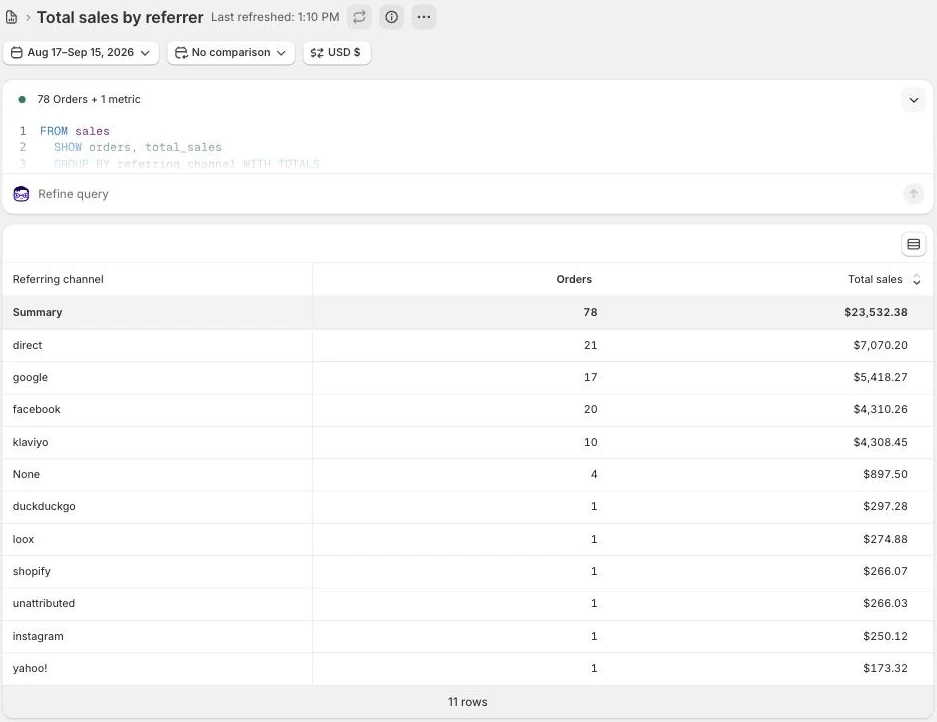
Shopify's Total sales by referrer report, grouped by referring channel, for one store's 30 days about three months into the work (August 17 to September 15, 2026). Store name redacted.
Shopify’s own example on its marketing reports page makes the rule plain. A shopper finds you on Google, comes back several times that week, then buys after clicking an email.
Google was the first interaction. Email gets the credit.
Search covers the unpaid clicks as well as the paid ones, so once your products sit in Google’s free listings, those orders land in this row too.
Why is so much of it Direct?
Direct is the catch-all for visits whose origin Shopify cannot see. According to Shopify’s glossary, that happens when a link is clicked from some email products, a mobile app, an instant message or a bookmark. It also happens when the browser has Do Not Track on, when a proxy or firewall blocks referrer data, or when a shortened URL was used.
The fix is tagging. Add UTM parameters, a source, a medium and a campaign name, to the links in your emails, posts and ads. Shopify’s guide to measuring marketing performance says traffic that arrives with utm_campaign parameters is attributed to marketing, so it stops hiding inside Direct.
On one store, for August 17 to September 15, 2026, Klaviyo credited email with 23 orders. Shopify’s referrer report traced 10 to an email click.
Both numbers are defensible. They count differently, and only one of them comes from the store itself.
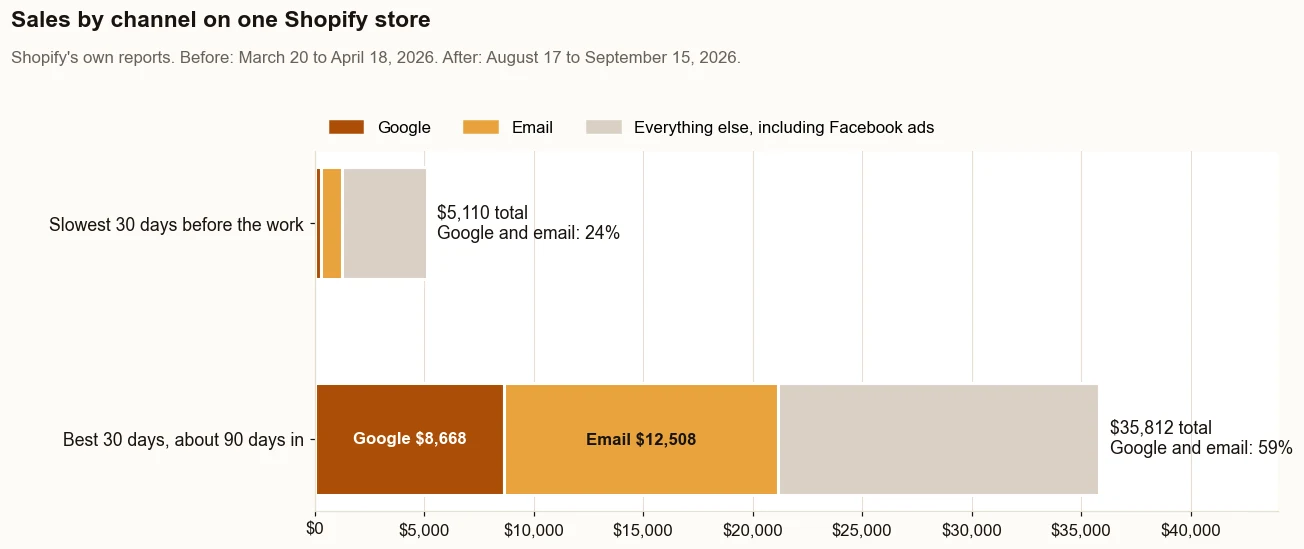
Google and email went from 15% of sales to 41%. Source: Shopify’s own reports. What it does not prove: this is one store, and the Facebook ads ran in both periods.
Why do Klaviyo, Meta and Google Analytics claim more than Shopify?
Because each tool counts its own credit by its own rules, and none of them is counting the others. Shopify counts each order once. Every tool grades its own homework, and a store should not fund its channels on the strength of their self-assessments.
What does each tool count?
Klaviyo counts a conversion when someone opens or clicks a message and then orders within its attribution window. Its help center on message conversion tracking says that window defaults to 5 days for email on newer accounts. Automatic Apple Mail Privacy Protection opens count too.
Ad platforms attribute sales by their own rules too. Shopify’s marketing performance page warns that a Facebook ad created in Shopify can show different results in Shopify and in Facebook, because the two credit interactions differently and data takes time to sync.
Shopify offers five attribution models when a report pairs a revenue metric with a marketing dimension: last non-direct click, last click, first click, any click and linear. Any click hands out more credit than you have orders, so use it to study one channel, not to add channels up.
“the last-click rarely represents the complete consumer journey”
That cuts both ways: Shopify’s last-interaction view undercounts the ad that introduced a buyer, while each platform’s own view overcounts itself, so compare the two and trust neither alone.
Here is what one store’s own attribution report showed when its two biggest sources of visits were put next to each other:
Google search, not paid24 ordersfrom 1,720 visits: 1.4 percent bought
Google search brought in more than 3.5 times the sales of the paid ads, from under a fifth of the traffic.
Source: Shopify’s sales attribution report for the 90 days before September 3, 2026. Google search brought $8,316 in sales and paid Facebook and Instagram $2,322, as charged. What it does not prove: the report credits each order to the visit it came from, so an ad that first introduced a buyer who later searched Google gets no credit.
How do you read the Sessions by referrer report?
It counts visits by where they came from, not revenue. Shopify’s acquisition reports say a session ends after 30 minutes of no activity, and at midnight UTC. One visitor can have many sessions, so sessions usually run higher than visitors.
The useful number comes from dividing. Take a channel’s orders from the referrer report above and its sessions from this one, for the same dates. That gives you visits per order, the figure no ad dashboard volunteers.
Sessions are also the denominator for a number most stores never check: how many of those visits you can email later, which is your visitor identification rate.
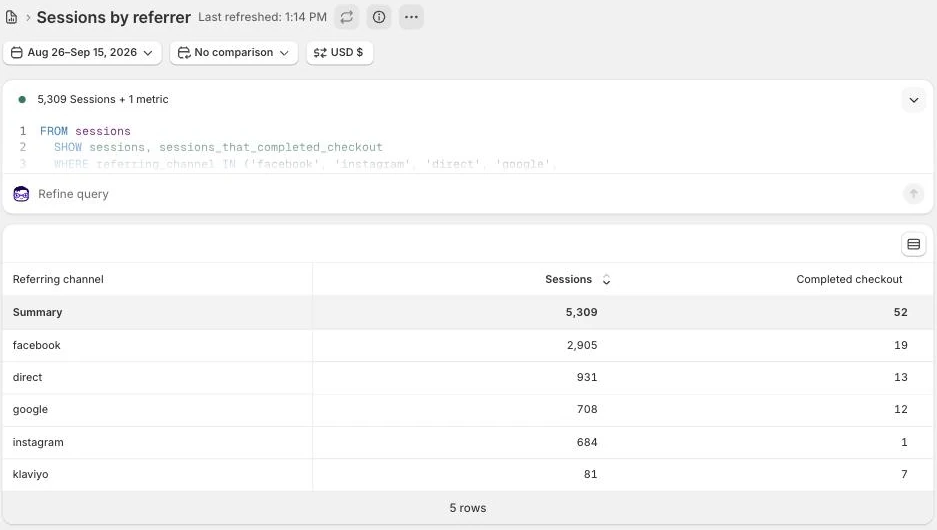
On one store, only 1 in 1,793 visits from cold Facebook and Instagram campaigns completed checkout (August 3 to 25, 2026). On warm audiences it was 1 in 179 (August 26 to September 15, 2026).
Both periods fall inside the work. That store’s Facebook checkout rate had ranged from 1 in 71 (March 2026) to 1 in 811 (December 2025), so treat it as one reading, not a rule.
Which sessions should you leave out?
Bots. Shopify’s page on bot filtering says every session is labeled human or bot, and a Human or bot session filter removes the bots. It applies only to data from October 7, 2025 on.
You. Viewing the store from your desktop admin counts as a session unless you open it with View store. Views from the Shopify app on a phone always count.
Shopify's Sessions by referrer report for the same store, warm audiences (August 26 to September 15, 2026), filtered to five channels. Store name redacted.
What does Shopify Live View show?
Shopify Live View is a real-time map of your store: who is on it right now, what has sold since midnight, and what shoppers did in the last 10 minutes. Open it from Analytics, then Live View. Blue dots are recent visitor sessions and purple dots are orders.
Visitors right now: people active on the online store in the past 5 minutes. To stay active, a visitor has to view a page or click a button.
Total sales, total sessions and total orders: counted since midnight in your store’s time zone. Orders and revenue include your other channels too.
Customer behavior: sessions in the last 10 minutes with active carts, sessions checking out, and sessions that purchased.
Top locations and top products: where visitors are, and which product has earned the most since midnight.
Why do visitors show up in the middle of the country?
When Live View cannot place a US visitor from their IP address, it puts the dot at 38°N 97°W, roughly the geographic center of the United States. Search engine bots, crawlers and VPN users land there, so a cluster of dots in the middle of the map is not a surprise market.
Use the map on launch days, during an email send or over Black Friday, to see a spike arrive. Do not judge a channel on it. Five minutes of dots tells you nothing about what a month of that traffic is worth.
Can you trust Shopify's conversion rate?
Trust it as a trend, not a verdict. Conversion rate is the share of sessions that ended in an order, so anything that inflates or hides sessions moves it without a single order changing.
Cookie rotation. Shopify’s page on session cookie rotation says a script or consent app that keeps regenerating the session cookie makes one visit count as several. Conversion rate looks lower. Orders, revenue and customer counts are untouched.
Consent banners. Where a cookie banner is active, Shopify collects data only after a visitor consents, so session counts and other session-based metrics can drop. That is on its page about customer and session discrepancies.
Bots. Filtering them out often raises the rate, because bots browse product pages and rarely buy.
That is why sales per visit, total sales divided by sessions, is often the better health check. On one store, sessions went from 4,276 in the 30 days before the work began (May 5 to June 3, 2026) to 7,970 in the 30 days about three months in (August 17 to September 15, 2026). Conversion rate went from 0.9% to 0.9%, almost flat, while sales per visit went from $2.13 to $2.95.
Bigger orders and better traffic drove that, not more checkouts per visit. It is one store, and its Facebook ads ran in both periods. Judged on conversion rate alone, the work would have looked like a failure.
Is Shopify analytics broken, or just counting differently?
Usually it is counting differently. When Shopify analytics looks broken, start with the rules about access, cookies, bots and report versions, because each one has a quick check.
If you have spent an evening trying to make the numbers line up, you know how exhausting it is. Match the symptom first, then run its check:
What you see
The rule behind it
What to check
Analytics or its reports will not open
Shopify says its main analytics features come with every subscription plan, and staff members need the Analytics permissions to see reports and dashboards
The staff account’s permissions, then Shopify Support
Sales, but hardly any sessions
Sessions and visitors are based on cookies, and where a cookie banner is active, Shopify collects visitor data only after consent
Which regions your cookie banner covers
More sessions than seem possible
Bots, a script or consent app that keeps rotating the session cookie, and your own visits to the store
The Human or bot session filter, then any app added around the time the numbers jumped
A report you relied on is missing or looks different
Shopify updated its analytics framework in October 2024, so reports saved before then can show updated data, and some report names changed
Then put a full week of sales next to a full week of sessions. If sales hold steady while sessions swing, suspect the counting before you suspect the store.
What do Shopify reports show on two more stores?
The same reports on a store that also sells in person, and on a store that added GA4, show what the case study cannot. A register puts counter sales into the same reports as web sales, and analytics data needs cleaning before it is read.
One store sells at a counter and online through one Shopify account, with Shopify POS on the counter. In the 90 days to September 18, 2026, its register recorded 518 orders and $20,063, up from 80 orders and $2,859 in the 90 days before.
The caveat travels with that number: the register was being adopted during the window, so the jump mixes real growth with the adoption itself. Its online store took 20 orders and $2,218 in the same 90 days, down from 27 orders and $2,981.
Two more lines from the same admin matter for email. The average register order was $38.73 against $110.88 online, and only 113 of the 541 orders the store took in those 90 days carried a customer email address. Source: the store’s Shopify admin, pulled September 18, 2026.
A second store showed why Google Analytics comes after these reports, not before. Its GA4 numbers did not mean anything until a cleaning rule was in place: one country only, with two states marked as internal traffic and the data-center cities filtered out. Source: the store’s GA4 account, checked September 23, 2026.
Shopify’s order and sales figures need no such rule, because an order is recorded whether or not a browser ran a tag. What neither store proves: 90 days on one and one filter on the other say nothing about what your reports will show.
Shopify analytics vs Google Analytics: which should you trust?
Trust Shopify analytics for revenue and orders, Google Analytics for how visitors move around the site, and Search Console for what happened on Google before the click. They measure different things, so they will never match exactly.
Tool
What it counts
Best for
Where it falls short
Shopify analytics
Orders, revenue and sessions, from the store itself
What sold and which visit came right before it
Detail on the path through the site
Google Analytics 4
Events that its tag sends from each page
Behavior, landing pages and tagged campaigns
Visitors who block cookies, JavaScript or its tag
Google Search Console
Impressions, clicks and positions on Google
Which searches show your pages
Anything after the click
Shopify’s page on analytics discrepancies lists why its numbers differ from Google’s. Google can only count visitors with JavaScript and cookies turned on, browser extensions can block it, and the two may use different reporting time zones.
“GA tracks what happens when a user goes to a site.”
How do you run a 15-minute Shopify analytics check?
Pull the same 30 days from each report and keep track of the numbers side by side. This is the first stage of The Traffic to Sales Method, and it needs nothing but your Shopify admin and the dashboards you already pay for:
Open Total sales over time for the last 30 days. Compare it with the previous period and the same period last year, then note revenue and orders.
Open Total sales by referrer for the same dates. Write down the share from Search, Email, Social and Direct.
Open Sessions by referrer. Divide each channel’s orders by its sessions to get visits per order.
Add the Human or bot session filter and see whether any number changes much.
Open three recent orders and read each conversion summary: where the first visit came from, and how many visits came before the order.
Put each platform’s claim next to Shopify’s count: attributed orders in Klaviyo, purchases in your ad account, purchases in GA4.
Circle the biggest gap. That is where to start.
The conversion summary in step 5 sits on every order page. Shopify’s page on the order conversion summary says it shows the customer’s visits over the last 30 days and the origin of their first visit. The details can take up to 48 hours to appear.
They prove what sold and which visit came right before each order. They do not prove why a customer bought, or what would have happened without a campaign. Keep these limits in view when you make business decisions:
First interactions expire. If a visitor goes 30 days without buying, Shopify resets the first interaction to the next referrer.
A store-wide total hides everything that matters, so split every report by channel, by new or returning customer and by device before you draw a conclusion.
Do you need a Shopify analytics app?
Most stores do not need one to see where orders come from. The built-in reports, custom reports and ShopifyQL already cover it. A reporting app earns its fee when you need something Shopify does not track, such as ad cost from several platforms in one view.
On the developer side, Shopify’s documentation on building with Shopify Analytics says ShopifyQL is the query language behind it. The metric cards, dashboards and reports in the admin all run on it, and apps can query the same data through the GraphQL Admin API. That is what most people searching for a Shopify analytics API are after.
Two cautions before you start paying for one:
Cost data still lives in the ad platforms’ own reporting. Shopify’s Growth page does not show cost, ROAS, CPA or clickthrough rate for Facebook and Google campaigns, so you still need Ads Manager and Google Ads to track spend. The math is in the ROAS formula guide.
An app that credits itself is one more tool grading its own homework. Whatever it reports, check it against Shopify’s referrer report for the same dates.
If an app’s numbers never reconcile with Shopify’s, question the app, not the store.
What does good Shopify analytics look like for your store?
You open three reports and know, in minutes, what sold, which channels brought the buying visits, and where the other tools disagree. That is Shopify’s reporting doing its job. Decisions about ad budgets and email get made from Shopify analytics, not from whichever dashboard is loudest that week.
On the store in the case study, reading Shopify’s own reports this way came first. Its total went from $9,110 in the 30 days before the work began (May 5 to June 3, 2026) to $23,532 in the 30 days about three months in (August 17 to September 15, 2026). It is one store, and its Facebook ads ran in both periods.
Straight from the case study, with the source and what it does not prove. See all five results.
Result 2 · Email
Sales from email: $987 to $4,308 in about 90 days
Before the work$987
→
About 90 days in$4,308
4.4x
Baseline: the 30 days before the work began
$987 from 7 orders that came in through an email, 11% of sales, May 5 to June 3, 2026.
The work: what changed
Built welcome, abandoned cart, browse abandonment, win-back and high-ticket follow-up emails in Klaviyo (live July 28). Found that the weekly email only went to people who joined the list after it was switched on, so it reached 13 people in six weeks. Replaced it with a scheduled weekly email (September 4) that reached 484 people on its first send (September 8).
Result: about three months in
$4,308 from 10 orders that came in through an email, 18% of sales, August 17 to September 15, 2026, 4.4 times the baseline.
Evidence source
Shopify Analytics, Total sales by referrer, Klaviyo row, pulled September 18, 2026.
What this does not prove
One deposit order, worth $2,080, was placed 17 minutes after the buyer clicked a welcome email. Without it, email brought in $2,228, still 2 times the baseline. Klaviyo credits email with more, 23 orders for the same dates, because it counts any order placed within days of someone opening or clicking an email.
Test it on your store
In Klaviyo, open each flow and compare recipients over the last 30 days with the size of the list it should reach. Then open Total sales by referrer in Shopify for the same 30 days and find the Klaviyo row. A flow reaching a fraction of its list, or a Klaviyo row near zero, is the place to start.
Shopify Analytics is the set of dashboards and reports built into the Shopify admin. It includes an Analytics dashboard of metric cards, a Reports list grouped into categories such as Acquisition and Marketing, and Live View for real-time activity. Shopify says its main features are available on every subscription plan.
Which Shopify report shows where sales come from?
Total sales by referrer. It lists revenue by the site that sent the buying visit, grouped as Direct, Search, Email, Social or Unknown, and it uses the last interaction before the order. Read it next to Sessions by referrer to see how many visits each channel needs for one order.
Is Shopify analytics free?
Yes, it comes with every plan. Shopify's help center says the main analytics features are available on any subscription plan, and as of September 2026 Shopify's pricing page lists more than 200 real-time reports, plus custom analytics, on every plan from Basic up. Paid analytics apps are optional extras.
Why does Shopify show fewer email orders than Klaviyo?
They count differently. Klaviyo credits an order to an email the buyer opened or clicked within its attribution window, including automatic Apple Mail opens. Shopify credits the site of the visit that placed the order. On one store, for August 17 to September 15, 2026, Klaviyo credited email with 23 orders and Shopify traced 10 to an email click.
How accurate is Shopify analytics?
Its revenue and order figures come from the store itself, so they are the most reliable numbers you have. Session figures depend on cookies, so consent banners, blocked cookies, bots and cookie rotation can move sessions and conversion rate without changing a single order. Treat conversion rate as a trend, not a verdict.
What does Visitors right now mean in Shopify Live View?
It is the number of people who have been active on your online store in the past 5 minutes. To stay active, a visitor has to view a page or click a button. Shopify notes the count can differ from Google Analytics because each service counts visitors in its own way.
How far back does Shopify analytics data go?
Session-based metrics such as sessions, conversion rate and add to cart rate only go back to October 1, 2022, and inventory-based metrics to October 1, 2023. Bot filtering applies only to sessions from October 7, 2025 on, so older traffic cannot be split into human and bot.
What is the difference between Shopify analytics and Google Analytics?
Shopify records orders and revenue from the store itself. Google Analytics records events its tag sends, so it only sees visitors whose browsers run the tag and accept cookies. Use Shopify for what sold and Google Analytics for how visitors behaved, and expect the two to differ.
Which Shopify analytics metrics should you focus on?
Four metrics cover most decisions: total sales, orders, each channel's share of sales in Total sales by referrer, and sales per visit, which is total sales divided by sessions. Treat conversion rate as a trend only, because cookies, consent banners and bots move it without a single order changing.
Can Shopify analytics show how many people read a blog post?
Partly. Shopify's Sessions by landing page report shows the page each session started on, so a post that brings visitors in from Google or a social link appears there. Readers who click through to it from another page do not. To count views of each page wherever the visit started, use the Pages and screens report in GA4.